Related Blogs
Ready to Build Something Amazing?
Join thousands of developers building the future with Orkes.
Join thousands of developers building the future with Orkes.
Distributed systems have many advantages: horizontal scalability, increased fault tolerance, and modular design, to name a few. On the flip side, distributed systems are also much harder to debug compared to centralized systems. In this article, let’s explore the challenges of debugging distributed systems and some strategies to make it easier.
Bugs are errors in the program that cause unexpected behavior. This can stem from unit-level errors in syntax, logic, or calculation, or system-level issues like integration errors or compatibility issues. In general, there are three tiers of complexity in debugging:

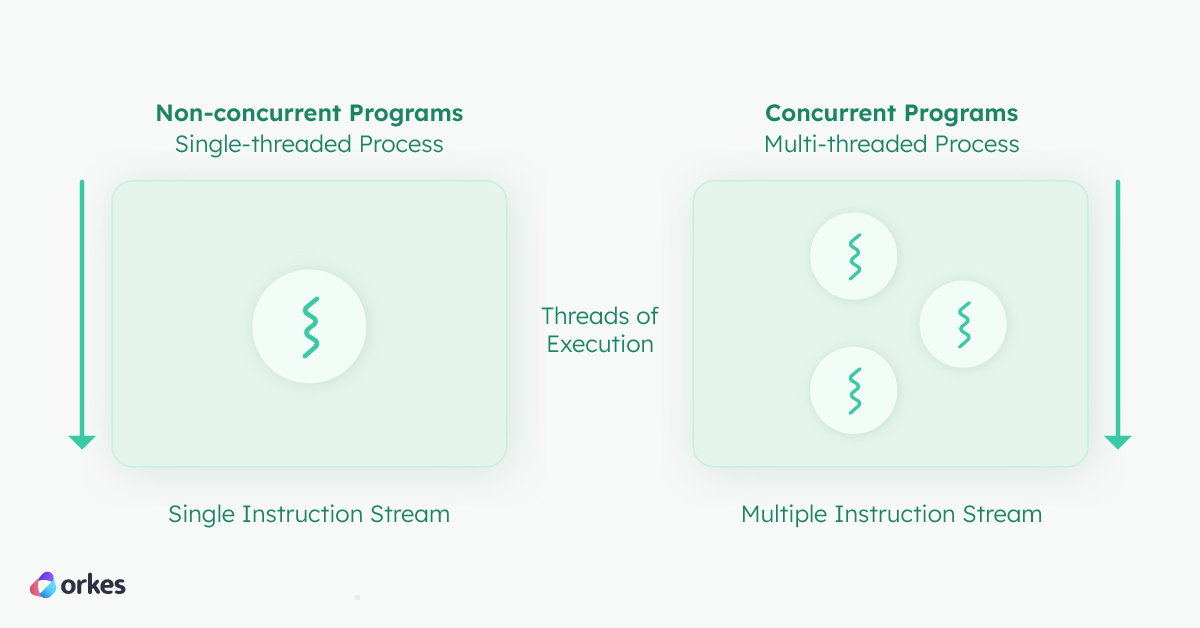
Non-concurrent programs run a single thread of execution, which makes debugging relatively straightforward. At a basic level, most bugs can be caught by attaching a debugger to the program and enlisting fundamental debugging methods like breakpoints and stepping through code, print statements and inspecting the variables during program execution, and examining the call stack and memory at runtime.
Concurrent programs run multiple threads of execution using shared resources. In a concurrent program for example, one thread could be used to display content, another to load animations, and yet another for copying content, and so on. These threads do not have a guaranteed order of execution, yet some threads may depend on another thread’s output before it can execute.
Because the behavior of one thread can affect other threads, concurrency introduces an additional layer of complexity. Bugs can arise due to race conditions, deadlocks, or other synchronization issues. Such issues are more difficult to detect and reproduce as they are non-deterministic and occur based on specific real-time conditions like execution order and timing.
To debug a concurrent program, execution logs, thread dumps, and stack traces play a vital role in figuring out the behavior and interactions between threads. You can leverage a debugger to identify and reproduce bugs by recording and replaying the program execution. However, with concurrent programs, strategies like using breakpoints and logging should be implemented carefully to avoid interfering with the timing and synchronization of multiple threads.
Distributed programs consist of multiple connected nodes that communicate with each other over a network to complete a goal, like file storage, streaming, user management, or payment processing. Each node runs its own thread or threads of execution, and each node has its own memory, resources, and execution context. As such, for distributed programs, even if every node is non-concurrent, the entire system is ultimately concurrent.
At this level of complexity, debugging becomes much trickier. More than just debugging code, developers must also understand and account for interactions, timing, and emergent behaviors in order to identify the root cause.
Limited observability
One key constraint for debugging distributed systems is limited observability at a global scale. Many traditional debugging strategies are typically confined to one node or machine at the execution level: using a debugger, inspecting the logs, or profiling the execution. Given that the entire system’s state is distributed across multiple nodes, these strategies often only provide a partial view of what is happening. Without a global view of the entire system, it is difficult to piece together the interactions and circumstances that have led to the error and to test your hypotheses.
Reproducibility
Concurrency bugs or bugs arising from the interactions between nodes are also much harder to reproduce and test due to their non-deterministic nature. The same input can lead to different behavior due to timing, network conditions, or load distribution. Such bugs are often timing-dependent or related to race conditions and may not replicate if the circumstances are altered. And when a system’s behavior also depends on environmental factors like the network set-up, the underlying infrastructure, or the scale of data load, bugs encountered in a distributed system become much harder to replicate in a local environment.
The observer effect
Finally, if not used prudently, many debugging strategies or tools can alter the behavior of the distributed system, masking the bug that you’re hunting down or creating new errors in the process. Debuggers also often slow down your program, which may impact time-sensitive or asynchronous interactions. This observer effect may make it harder to identify and isolate the root causes of the problem.
Given its tricky nature, what strategies can we use to debug a distributed program? It boils down to three key aspects of debugging: understanding what your code is trying to do, the execution, and how the code resulted in the execution.
Understanding the code:
For distributed programs in particular, rather than just understanding the code, it is vital to also develop an understanding of the overall flow of your distributed system and its interlocking dependencies.
What is the execution path in a success scenario? And what are the areas where errors can arise? For example, in a payment flow, how should the system handle a duplicate transaction, or what happens if the payment is authorized seconds before the card get frozen by the bank? Often, good design and thinking through the program flow are one of the first safeguards against bugs both pre-production and in production.
Understanding the execution:
Since distributed programs have logs distributed across different nodes, it would take much more time to pinpoint the relevant logs for debugging. To cut down the time taken to locate the logs, it would be useful to know the program execution flow and which nodes are involved in the error ahead of time.
This is where distributed tracing comes in handy for distributed debugging. These tracers follow a request as it moves across different nodes and services, capturing context about the interactions, behaviors, and errors encountered along the way, including where the errors originated and how they propagate through the system. Tools such as OpenTracing or OpenTelemetry go a long way for context propagation.
Understanding how the code resulted in the execution:
When using debuggers for distributed systems, you should take care to use them on the appropriate node to avoid masking the bug or creating other unwanted errors and timeouts. Remote debuggers can be used for remote nodes, and time-travel debugging can be used to reproduce hard-to-find bugs.
In cases where a debugger creates more problems than it solves, bisecting is a powerful alternative for locating the source of the error. Bisecting is a technique that uses binary search to quickly pinpoint the commit that introduced a bug to your code repository. At each point of the binary search, you will test the build for the bug before marking the commit as good or bad. While testing at high volumes may be time-consuming, with some automation, bisecting becomes a productive way to locate the source of the bug.
Let’s hear from our Orkes developers, the team behind the open-source orchestration engine Conductor (also a distributed system), on how we debug errors in a distributed system.
Even though distributed systems are highly complex with tons of moving parts involved, debugging such systems does not have to be too complicated. The key lies in narrowing the debugging scope: the vast majority of the bugs we deal with usually can be reduced to a single component, with a limited amount of context needed for the bug to occur.
Context propagation lays the groundwork for reducing the debugging scope. This can be as simple as carrying a unique ID across logs during executions, or using tools like OpenTracing or OpenTelemetry. With the information, we can find the exact section where the problem occurred and then isolate it.
Whenever Conductor users reach out about a bug, the first thing we do is to get the exact setup they have. This step is critical for confirming where exactly the bug is coming from, given that different version builds may have different code, and the code containing the bug may have already been changed.
To try to reproduce the bug, we get more details such as the logs, the workflow execution JSON, or any SDK code that the user ran. If successfully reproduced, we bisect across Conductor releases to find the exact change that caused the bug. From there, it’s an iteration of a discussion, a fix, and integration tests to prevent future regressions.
If there are difficulties reproducing the bug even with all the available context, we go back to the basics: analyzing the source code areas which could negatively impact execution. Sometimes, the bug is related to concurrency and multithreading, which requires careful analysis of the code and double-checking your own assumptions. As one of our developers says: "If you have a seemingly impossible bug that you cannot reproduce consistently, then it is almost always a race condition."
There is no silver bullet to debugging. When it comes to a thorny bug that relates to concurrency, we run through the same process of reproducing the bug but at larger volumes, and carefully thinking through the code. Ultimately, the best debugging tools are those that facilitate the process of thinking through the code.
Conductor is an open-source orchestration platform used widely in many mission-critical applications for LLM chaining, event handling, and microservice orchestration.
Orchestration is a powerful way to coordinate services and components in a distributed system. Beyond simplifying distributed development, orchestration tools like Conductor provide system observability for troubleshooting and debugging. In other words, it cuts out all the time spent on tracking down the source of the error so that developers get straight to thinking through the code and flow, slashing debugging time from hours or days to mere minutes.
Trace with ease
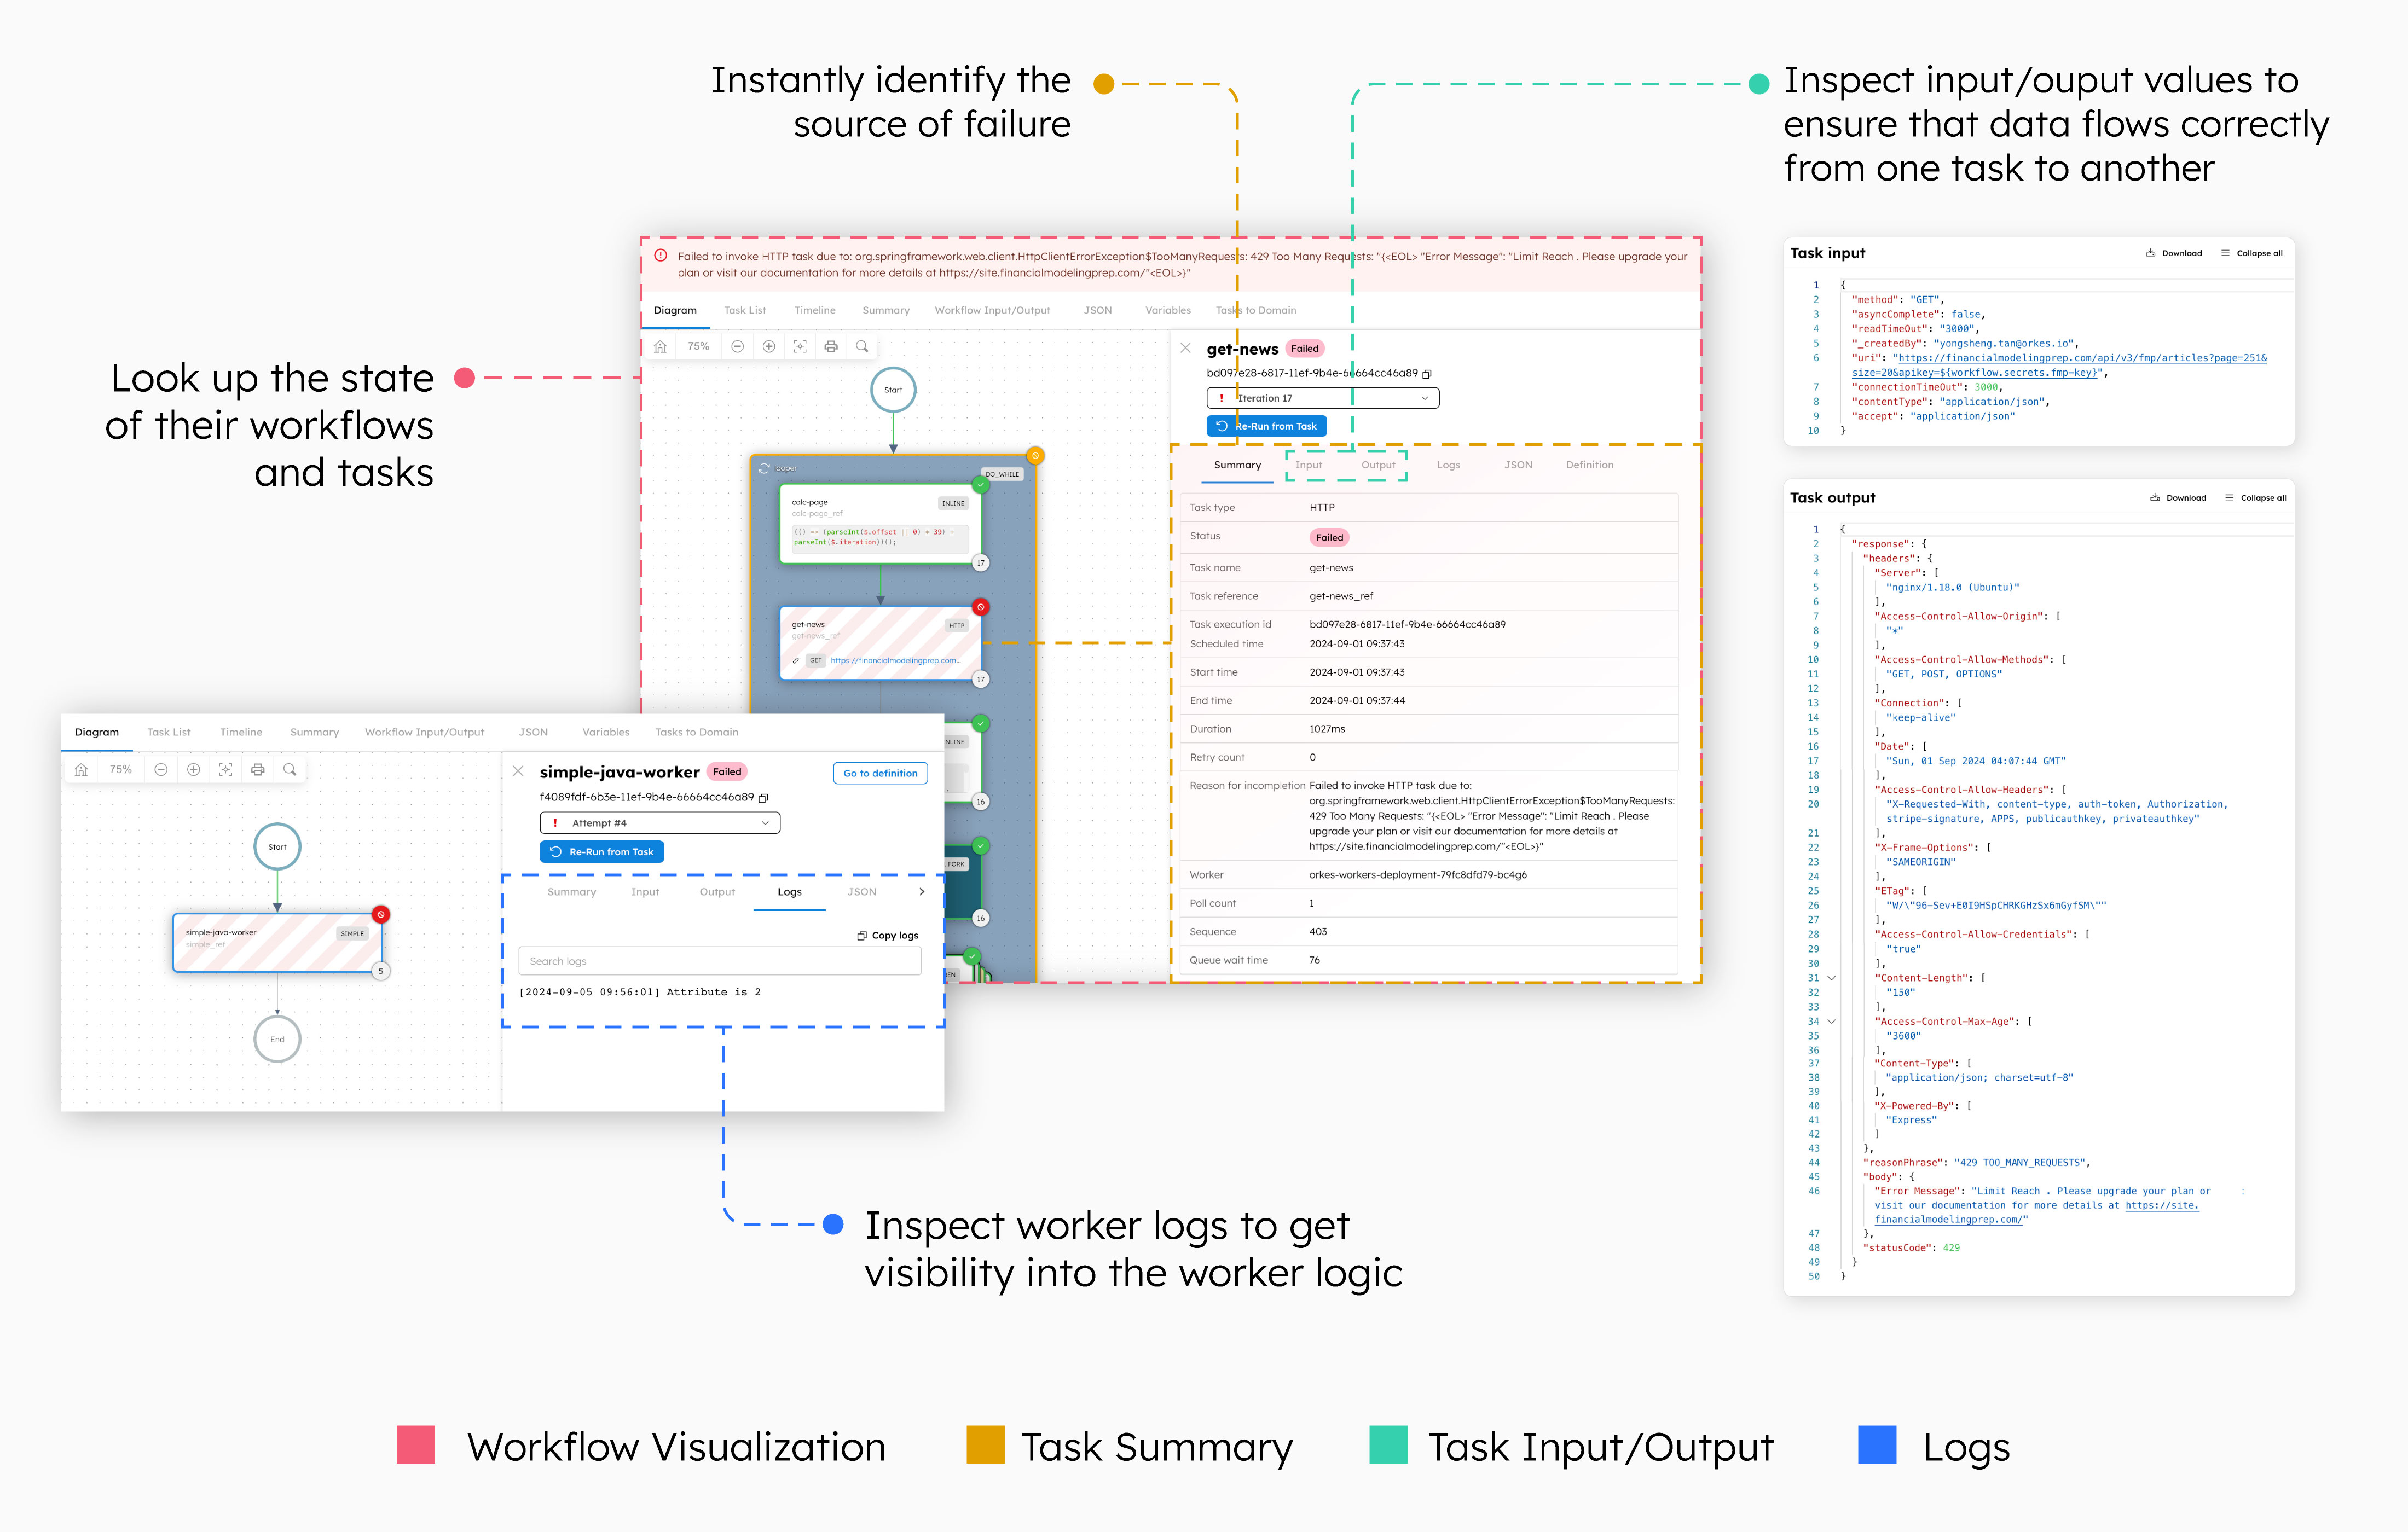
With Orkes Conductor’s workflow visualization and ID tracking, developers can look up the state of their workflows and tasks, instantly identify the source of failure, and inspect the execution details for execution time, input/output values, or worker logs. No need to spend time tracking down where the error occurred, manually printing variables, or hunting down logs.

Let’s take a look at an example distributed program flow of a data indexer. This program loops through a series of tasks, namely: a task that retrieves data from a third-party API, and a task that indexes the data into a vector database using an embedding model.
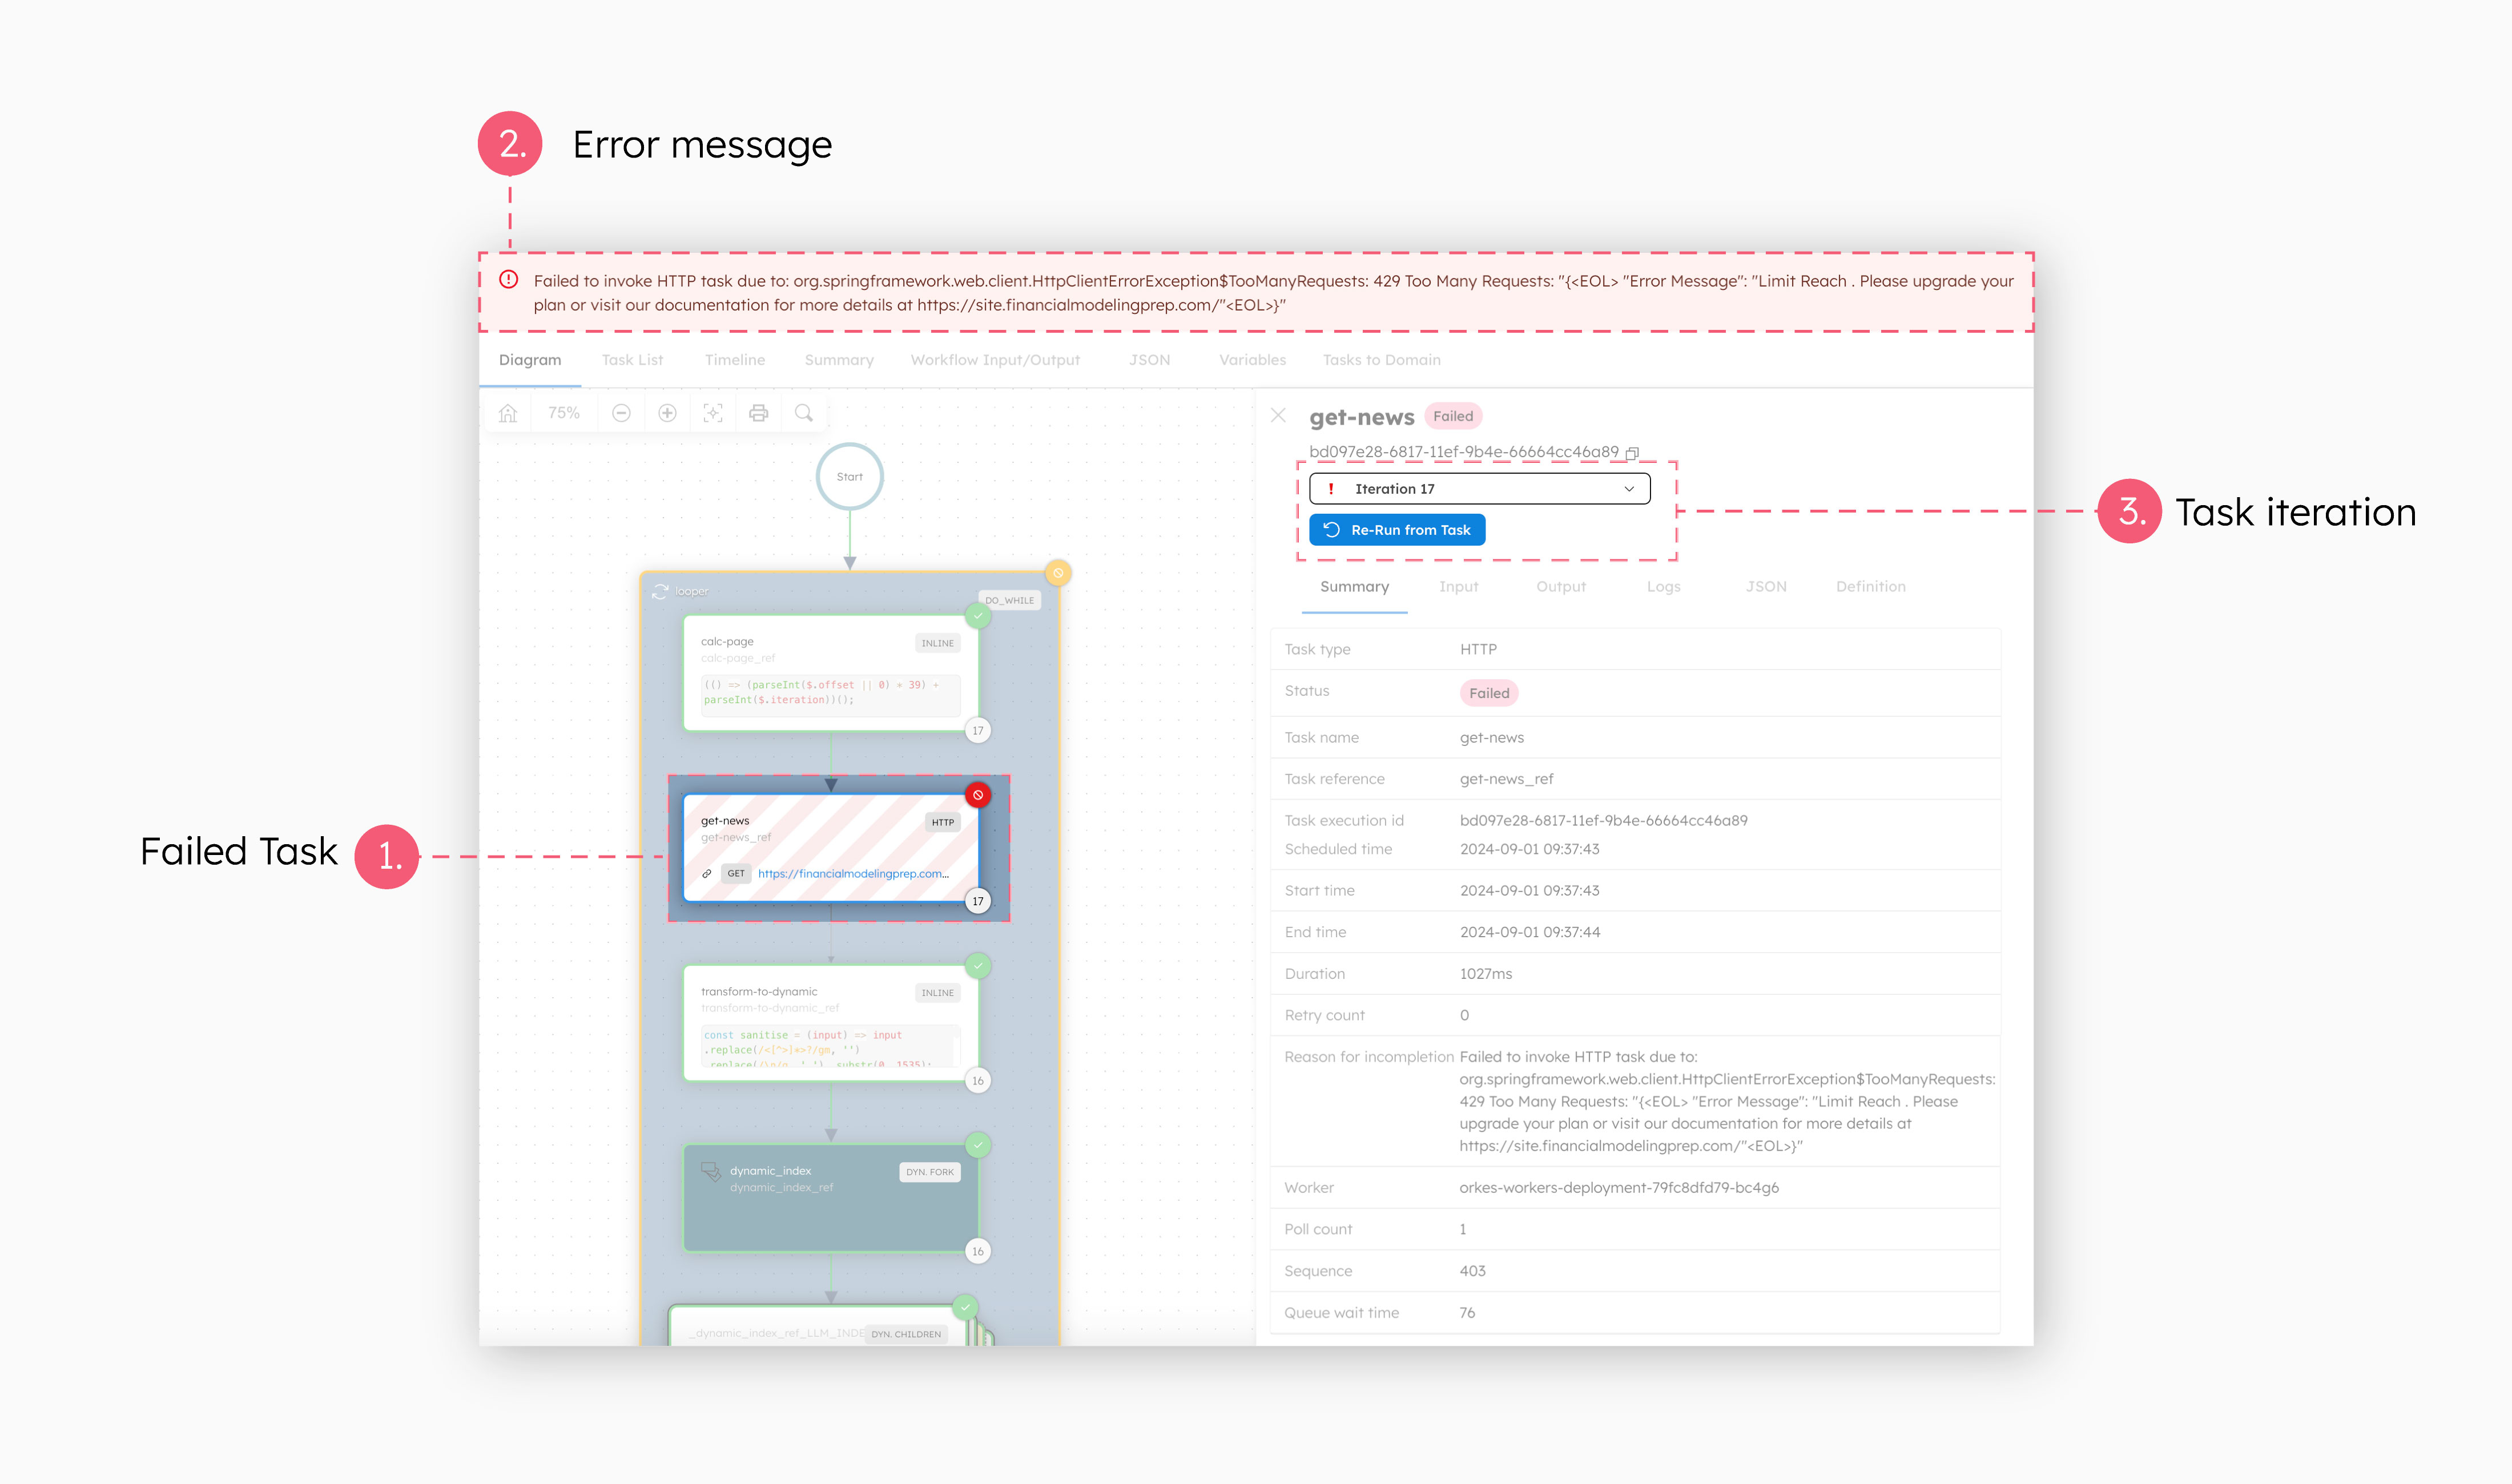
When a workflow fails, developers can use Conductor to retrieve or visualize the exact task where the error occurred, which instantly reduces the debugging scope. Conductor tracks the task execution details, which means you can then look up the source of the failure. In the case of the data indexer, the workflow failed during the data retrieval task due to a 429 (Too Many Requests) error.

With the bug easily identified, you can spend your time coming up with the solution instead—in this case, retrying the task again later or upgrading the third-party API limits. Since the data indexer workflow loops through its tasks iteratively to retrieve as much data as possible in a single run, you can also retrieve the execution details for each iteration. Here, you get to see that the flow terminated on the 17th iteration. These information help with making an informed decision on how to best resolve the problem.
Once resolved, Conductor enables developers to quickly recover from failure with programmatic calls to rerun, retry, or upgrade workflows.
Monitor at scale
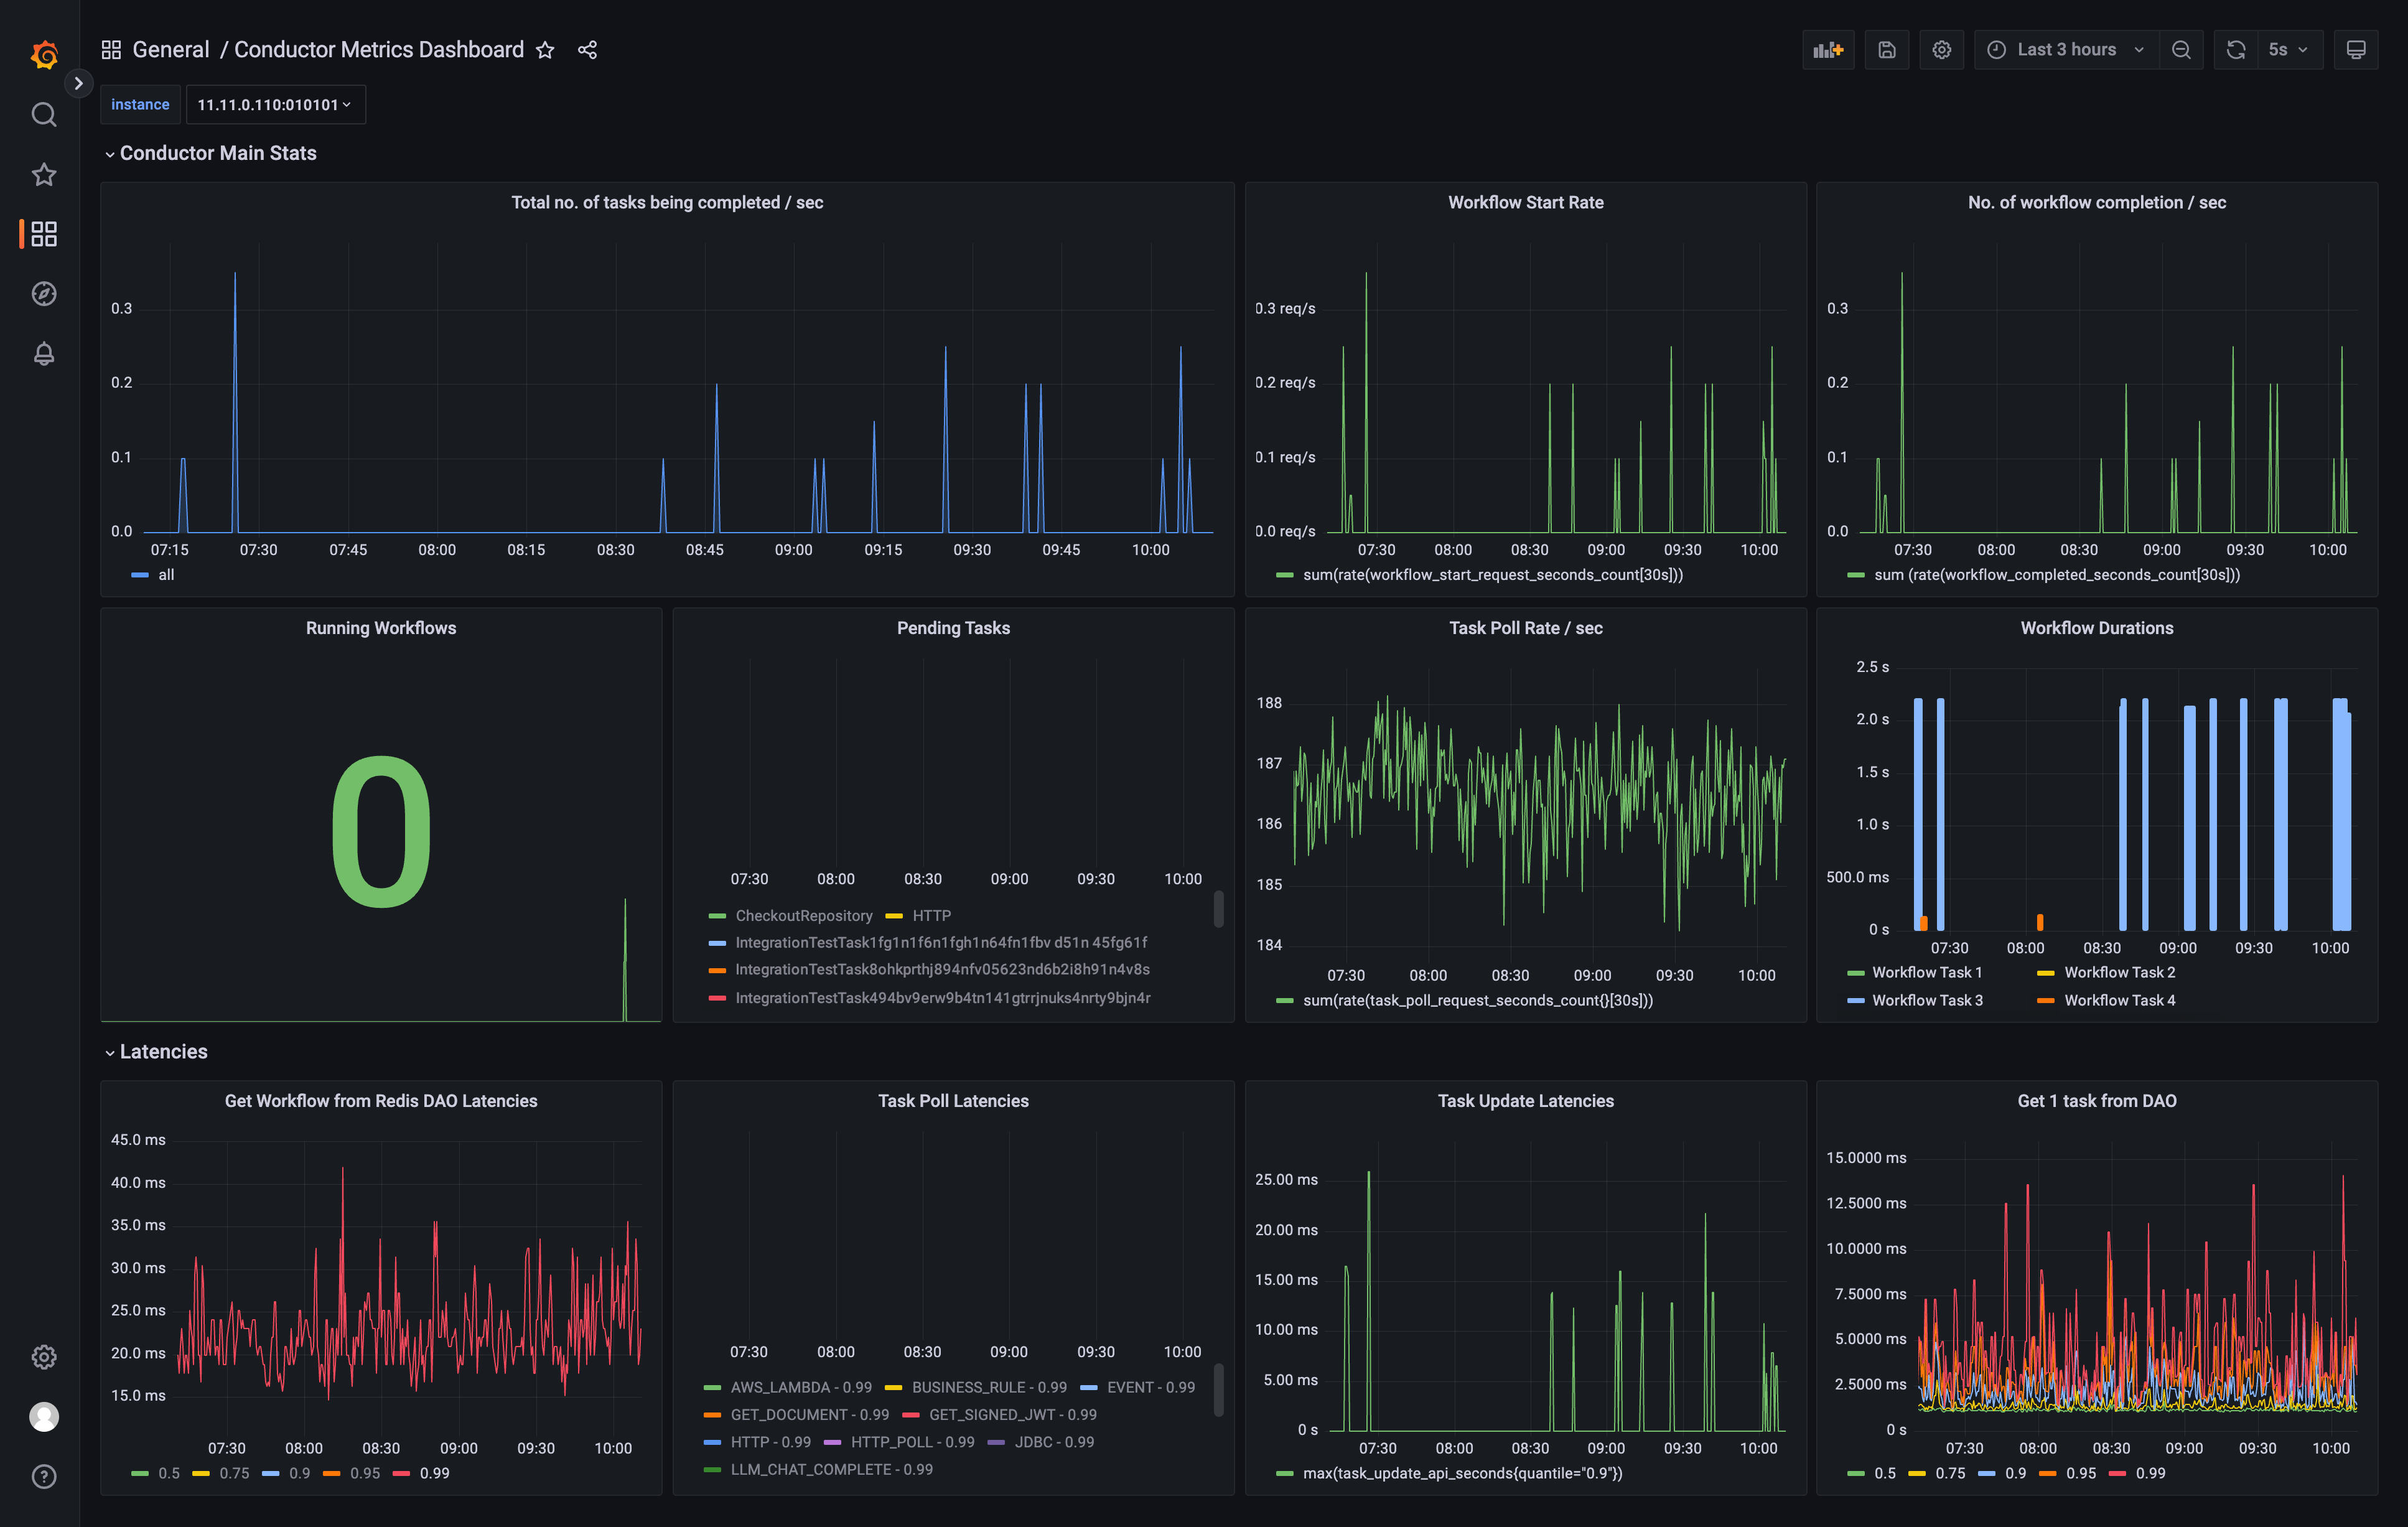
Orkes Conductor also provides a rich metrics dashboard to monitor your executions. Developers can get aggregated analytics for workflow execution volume and rate, system health, or latencies; configure alerts for critical thresholds; or export the data to a central metrics repository like Datadog or Prometheus. These metrics can help in making informed decisions on scaling workers, optimizing workflow speeds, and so on.

—--
Conductor is an enterprise-grade orchestration platform for process automation, API and microservices orchestration, agentic workflows, and more. Check out the full set of features, try it yourself using our Developer Edition sandbox, or get a demo of Orkes Cloud, a fully managed and hosted Conductor service.