ENGINEERING
Monitoring Microservices using Prometheus & Grafana

Riza Farheen
Developer Advocate
Last updated: August 1, 2023
August 1, 2023
8 min read


Join thousands of developers building the future with Orkes.
The tech giants like Netflix, Amazon, and the like have transformed our lives with innovative technology along with the adoption of microservices architecture. Microservices advocate breaking down complex applications into smaller, loosely coupled services; each focused on a specific business function. These services can be developed, deployed, and maintained independently, making managing and scaling applications easier, especially in large and dynamic environments.
Microservices have become increasingly popular as the preferred approach for building scalable and distributed applications. However, adopting microservices also comes with challenges. Distributed systems are inherently more complex, and managing the interactions between various services can introduce issues like network latency, service discovery, and data consistency. Therefore, effective monitoring becomes essential to ensure optimal performance and reliability.
Without a proper monitoring system, it is difficult to detect issues & therefore can affect the performance. In this article, we’ll have a quick overview of the importance of microservices monitoring and how tools like Prometheus and Grafana can be leveraged for collecting & publishing metrics in Orkes Conductor.
Measure what matters - Monitoring the health of a microservices architecture is crucial for ensuring its smooth operation. By consistently observing the system's performance, any potential issues can be promptly identified and addressed, preventing any potential catastrophic failures.
Imagine your application is like a human body with different organs working together. Each organ has a specific role. Likewise, each microservice has a unique job.
The human organs rely on the endocrine system to pass messages using hormones to ensure proper functioning. Similarly, the microservices communicate with each other to coordinate their actions and to run the applications smoothly. As we need regular check-ups to stay healthy, microservices need constant monitoring. It can help in quickly catching any problems at an early stage.
If the application APIs are monitored in a specific cadence, it can help with an early warning system for application failure. API Monitoring ensures that each API and the sequenced calls that make up a transaction are accessible, responsive, and delivering the right payload. This proactive approach allows you to isolate the issues and avoid failures quickly.
Yet another important benefit of consistent monitoring is data analytics. The collected data over a long period can be assessed to identify potential problems and causes.
A timely interference can also help to understand the overall status of the application, gain insights into the individual components, and identify potential bottlenecks, which ultimately helps in optimizing the end-user experience.
So, how do we monitor microservices? 📈📊
There are different tools for collecting & publishing metrics in a microservice architecture. However, let’s have a look at the most prominent monitoring tools: Prometheus & Grafana.
Prometheus is a popular open-source platform that scrapes metrics from an application. Metrics are stored and displayed in a time series database that can be queried in real-time, and alerts can be triggered.
Prometheus caters to metrics such as counter, gauge, histogram, and summary. These metrics can be retrieved and filtered efficiently using key-value pairs, enabling efficient querying and filtering. The Prometheus query language, PromQL, is a powerful tool for processing complex queries, aggregations, and transformations on collected data. A regular collection of metrics from various endpoints allows Prometheus to analyze or visualize them and trigger alerts when certain conditions are met.
It can be configured to set up alerts based on certain threshold conditions, ensuring you are notified immediately when specific metrics exceed predefined limits.
Check out their official documentation to learn more about Prometheus setup and installation.
So the metrics can be collected using a tool like Prometheus. Now how do we publish them? 🤔
That’s where tools like Grafana come into play. 🤾
Grafana is a widely used open-source observability platform for creating intuitive interfaces to visualize and analyze the data collected from tools like Prometheus. You can build user-friendly dashboards to gain valuable insights through visually appealing and customizable data visualizations.
Grafana offers various visualization options like charts, tables, heatmaps, graphs, and more, allowing it to build interactive dashboards to explore the metrics. Grafana has indispensable properties like template variables that enable dynamic filtering and switching of metrics, making it quicker to create dashboards that can be reused.
Check out their official documentation to know more about Grafana setup and installation.
Orkes Conductor leverages the popular platform Prometheus for recording a rich set of metrics that will be automatically available with your deployment and pushes the metrics to Grafana/Datadog on request to dedicated clusters.
Here’s a brief overview of how dashboards are created using Prometheus & Grafana:
A sample dashboard set using the powerful duo Prometheus-Grafana looks like this:
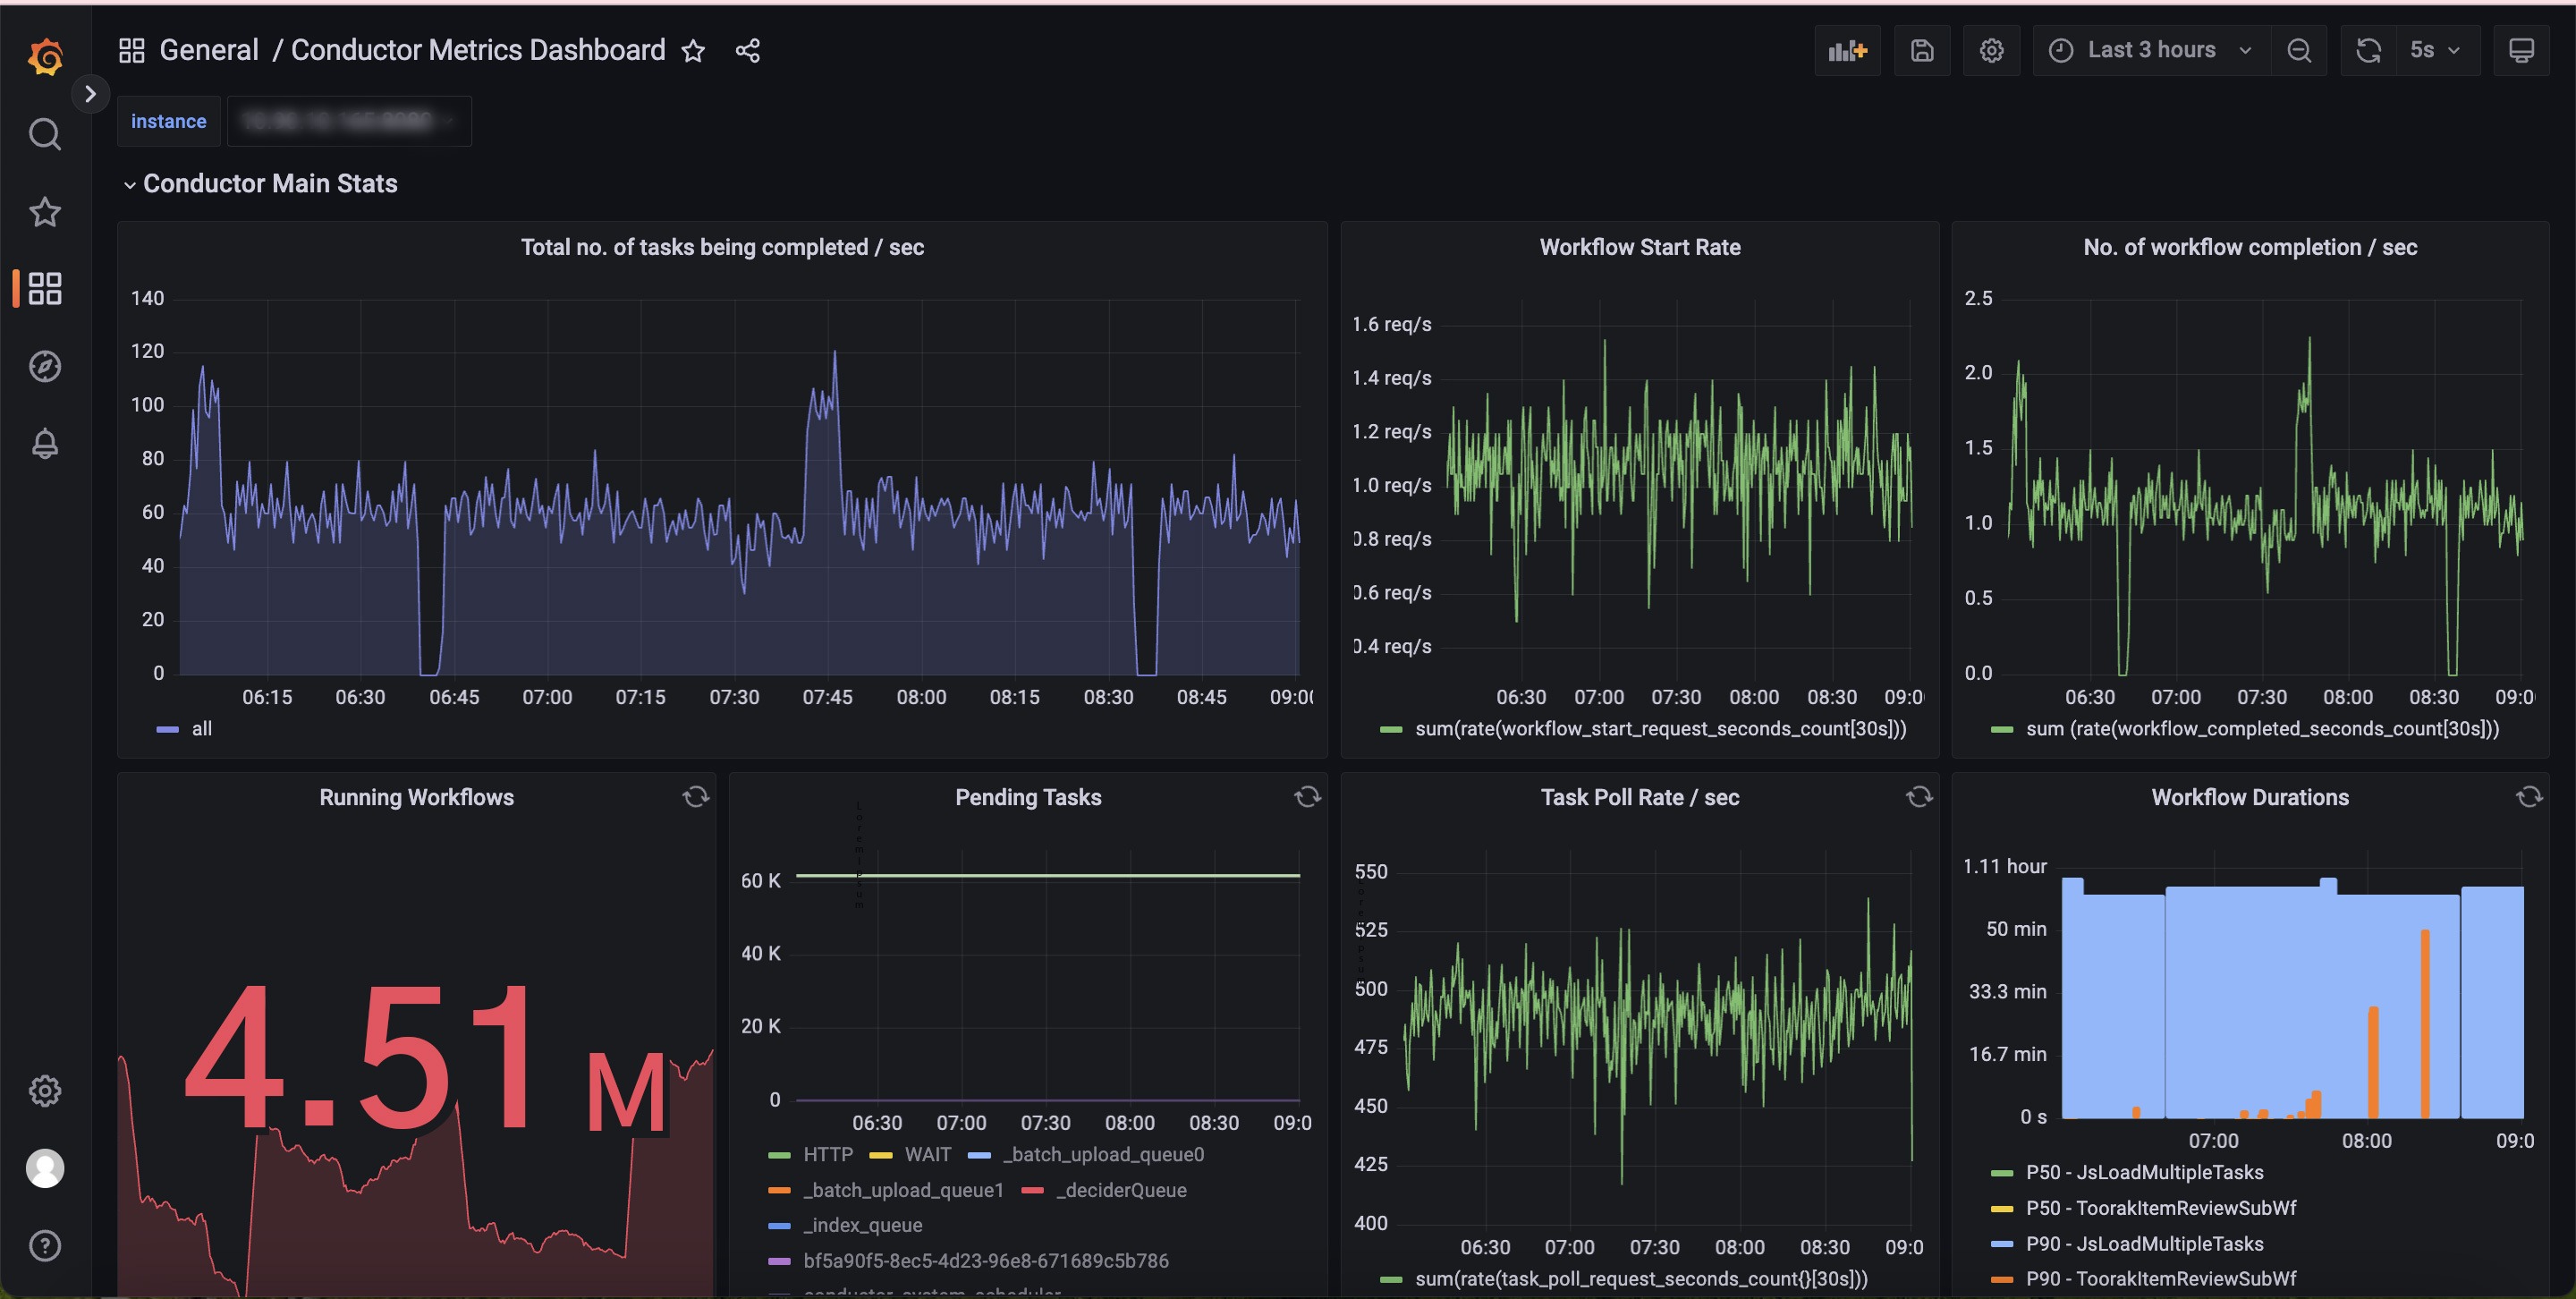
The dashboard helps analyze workflow metrics such as workflow latencies, task latencies, the rate of workflows/tasks running per second, success/failure rates of workflows/tasks, etc.
Check out our documentation for detailed insights on accessing the dashboard and the different workflow and task metrics.
Suppose one of the popular streaming platforms is set for the release of the second season of the most anticipated series, and viewers from around the world are eagerly waiting to dive in! 🍿🍿
For the engineering team, ensuring a flawless user experience is paramount. They should be well aware of the potential challenges of handling an unexpected surge in traffic during the series launch. The last thing is not to disappoint millions of excited viewers.
The team has meticulously prepared to tackle this challenge by conducting extensive load testing. They have simulated massive user traffic scenarios to see how the system performs under stress. This comprehensive testing approach allows them to identify any potential bottlenecks and weaknesses in their microservices architecture before the launch day.
But testing alone is not enough. Real-time monitoring is the secret that keeps everything in check during the event. Armed with powerful monitoring tools and insightful dashboards, the engineering team watches every aspect of the system.
When the show is launched, user traffic begins to surge, and the system comes into action. With diligent monitoring efforts, you can witness how each microservice responds to the increased load. Crucial metrics, like CPU usage, memory consumption, and network traffic patterns, can be analyzed for any deviations from expected behavior.
This data-driven approach empowers us to make informed decisions on the go. If a bottleneck is encountered, the affected microservices can be scaled to accommodate the influx of viewers. The agility and quick responses while monitoring ensures a seamless streaming experience for everyone, even amidst the overwhelming demand.
The result?
The series launches without a hitch, and the social media buzzes with excitement and positive reviews, enhancing the platform's reputation and solidifying its position as a top streaming service.
The real-time monitoring of the platform's microservices architecture was critical in ensuring a flawless user experience during the series launch. It empowered the engineering team to swiftly identify and address bottlenecks, enabling them to scale resources on the fly and guarantee a seamless streaming experience.
In the modern digital world where the convenience of technology has simplified our life, the success of applications like Amazon’s marketplace and Netflix’s streaming platform relies heavily on the power of microservices along with their effective monitoring. By implementing tools like Prometheus and Grafana, you can detect issues and optimize performance, providing exceptional user experience.
Before monitoring the microservice-based applications, you must ensure that you have a perfect orchestration tool. Orkes Conductor, built over Netflix Conductor, is one of the finest orchestration platforms for orchestrating your applications seamlessly. We offer Orkes Cloud, the enterprise version of Netflix Conductor, in major cloud platforms, AWS, Azure, and GCP.
Meanwhile, check out the open-source version of Conductor & start contributing now. Don’t forget to give us a ⭐!
Conductor is an enterprise-grade orchestration platform for process automation, API and microservices orchestration, agentic workflows, and more. Check out the full set of features, try it yourself using our Developer Edition sandbox, or get a demo of Orkes Cloud, a fully managed and hosted Conductor service.