Metrics and Observability
Orkes Conductor allows you to monitor workflow performance using tools like Prometheus, Grafana, and Datadog. The Conductor dashboard provides a centralized view of key metrics, allowing you to gain real-time insights and set up customizable alerts for proactive monitoring.
Dashboard setup
Orkes Conductor uses Prometheus to capture a comprehensive set of metrics, which are readily available in your cluster deployment. On request, these metrics can be pushed to Grafana or Datadog.
- For cloud deployments, Prometheus and Grafana/Datadog are provisioned by the Orkes team.
- For on-premise deployments, you must set up your own monitoring tools.
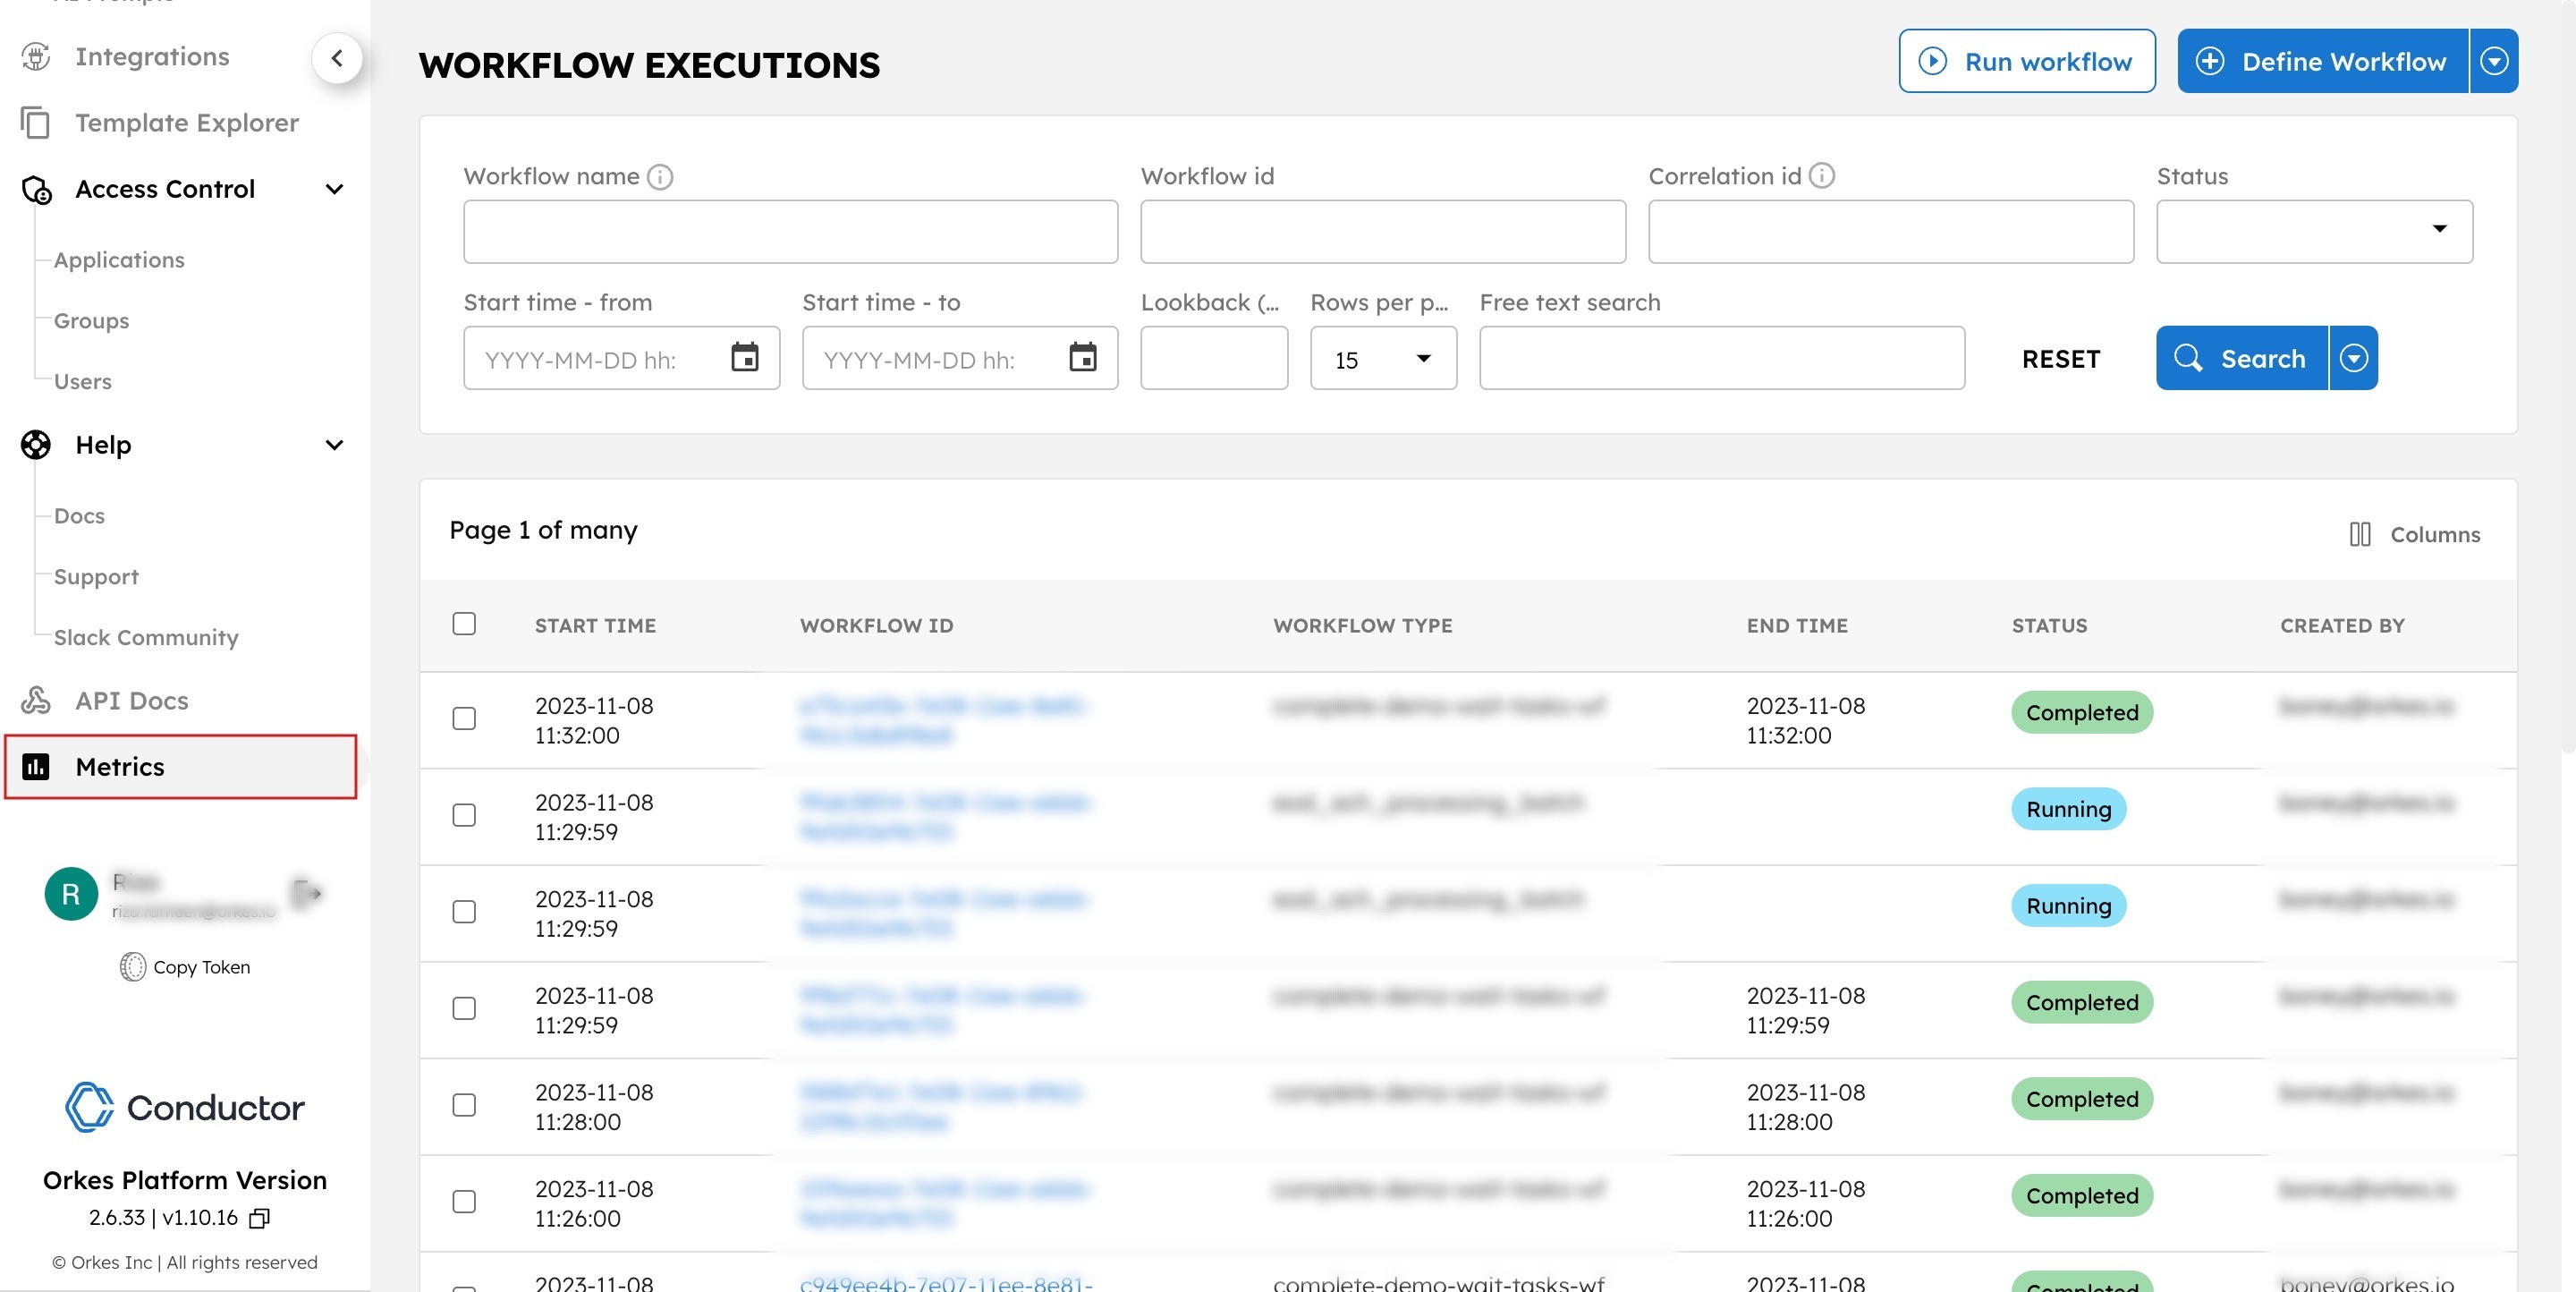
Accessing the dashboard
To access the dashboard, go to Metrics from the left navigation menu on your Conductor cluster.
To enable Metrics for your cluster, please get in touch with the Orkes team.
Example dashboard set up using Prometheus and Grafana
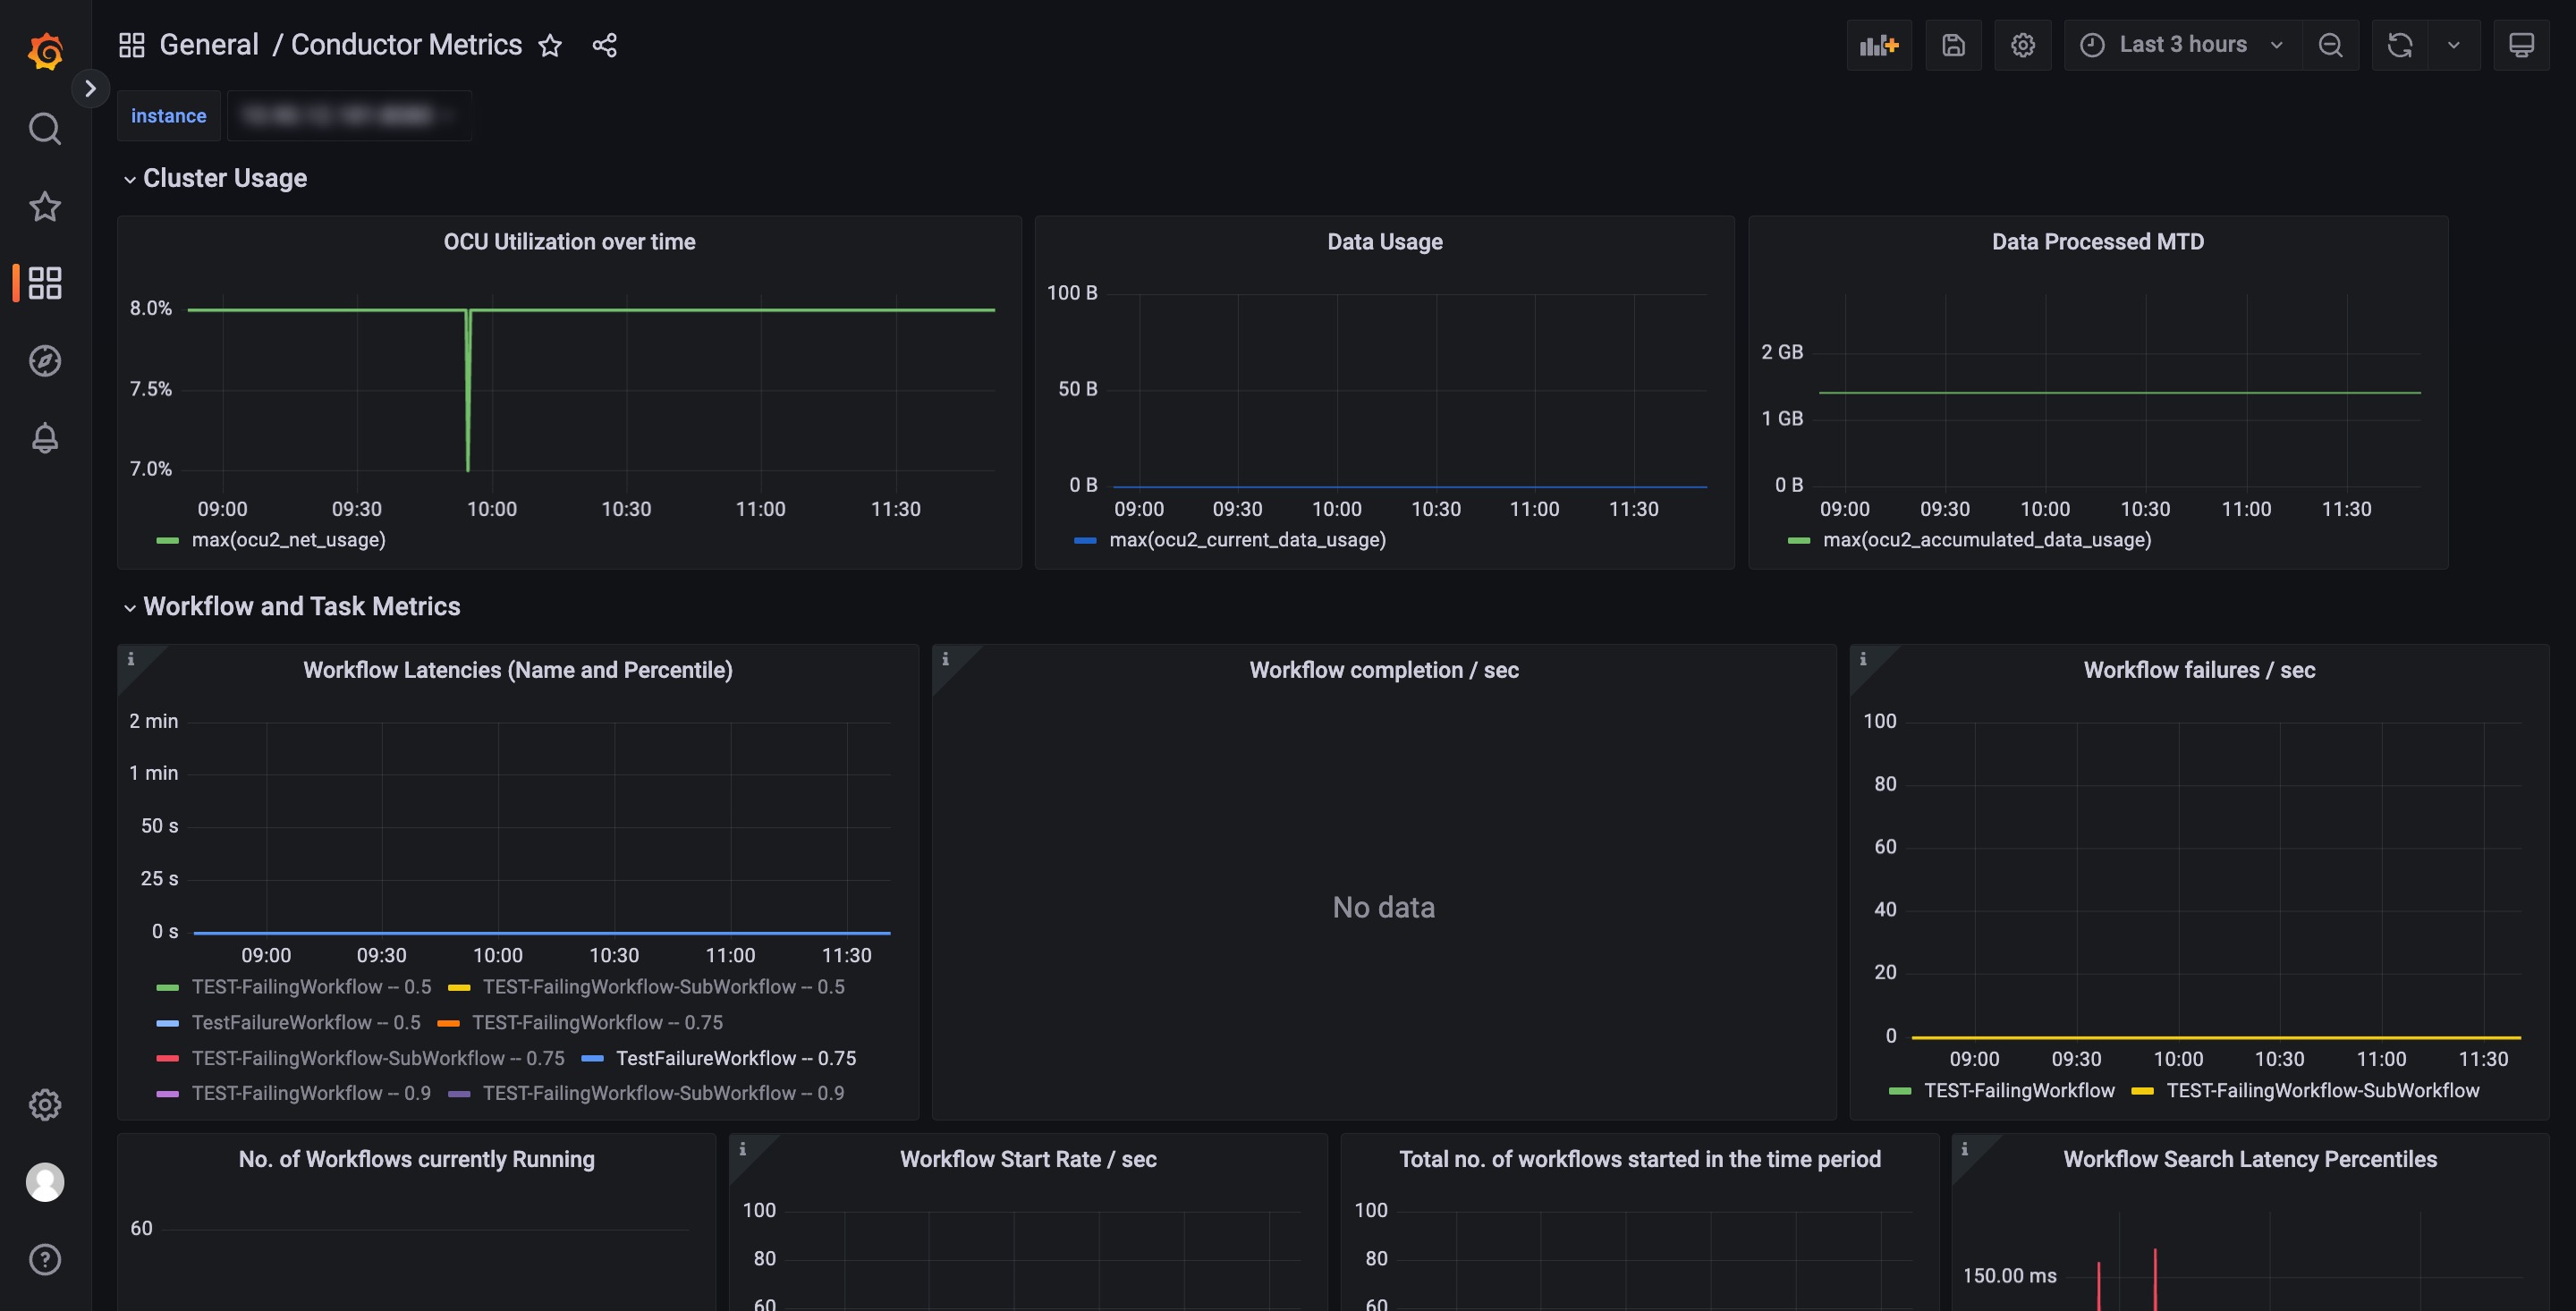
Conductor metrics
The Conductor server collects the following metrics via Prometheus, which can be visualized in Grafana/Datadog for monitoring and alerting.
Workflow metrics
| Metrics | Description | Tags |
|---|---|---|
| workflow_completed_seconds | Timer indicating the average time taken to complete the workflows. | workflowName, quantile |
| workflow_completed_seconds_count | Counter indicating the number of workflows completed per second. Apply the FAILED filter to get the failed workflows. | workflowName |
| workflow_running | Gauge indicating the number of running workflows. | workflowName |
| workflow_start_request_seconds_count | Counter indicating the number of workflows started per second. | workflowName |
Task metrics
| Metrics | Description | Tags |
|---|---|---|
| task_completed_seconds | Timer indicating the average time taken to complete the task. | taskType, quantile |
| task_completed_seconds_count | Counter indicating the number of tasks completed per second. Apply the FAILED filter to get the failed tasks. | taskType |
| task_queue_depth | Counter indicating the number of pending tasks in a given time period. | taskType |
| task_poll_request_seconds_count | Counter indicating the number of tasks polled per second. | taskType |
Configuring alerts via Grafana
Alerts can be configured for any metric from your dashboard or via the Alerting section in Grafana.
- To configure alerts for a metric from your dashboard
- To configure alerts from the Alerting section
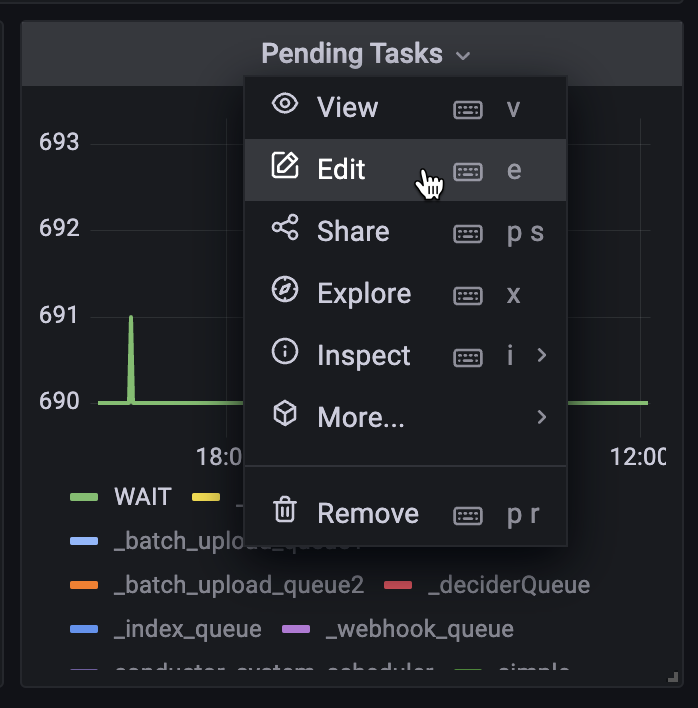
- Open your Grafana dashboard and select the metric.
- Select Edit.
- Go to the Alerts tab and select Create alert rule from this panel.
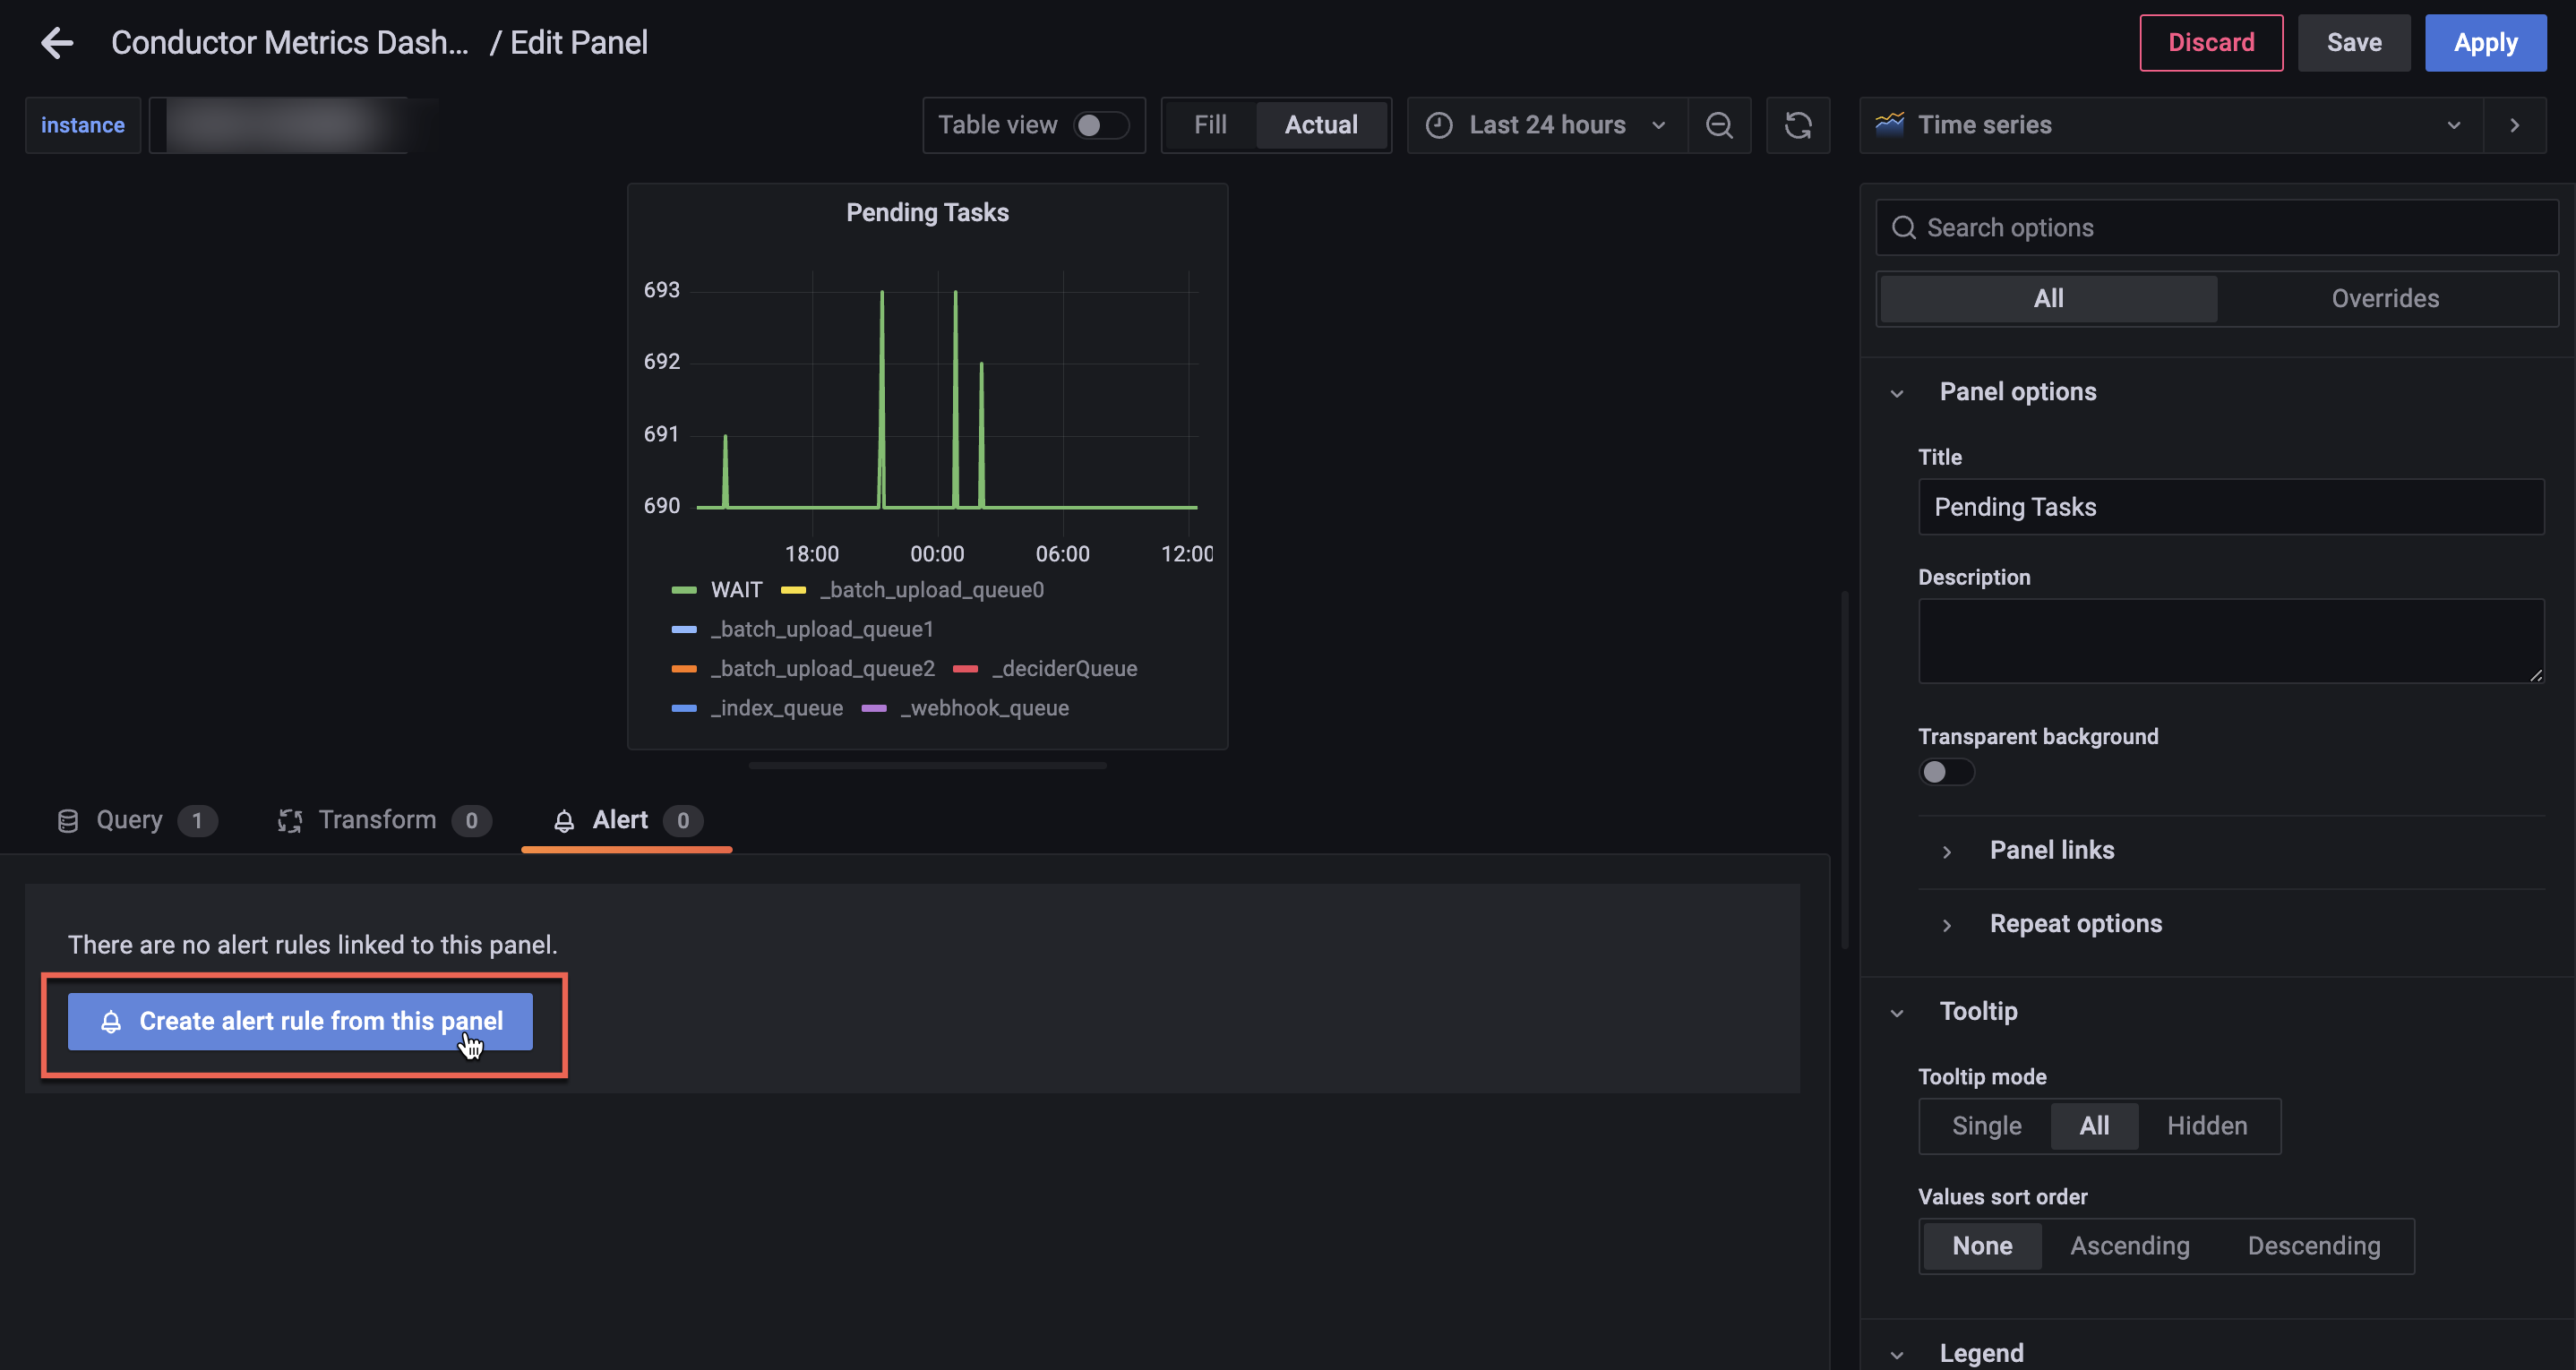
- Create the alert based on your requirements.
- Go to Alerting > Alert rules from the left navigation menu on your Grafana dashboard.
- Select + New alert rule.
- Create the alert based on your requirements.
Refer to the official Grafana documentation for more information on setting up alerts.