Quickstart 3: Monitor and Debug Workflows
Estimated time: 2min
Orkes Conductor provides comprehensive views into each workflow execution, enabling you to debug and monitor them while in development or production.
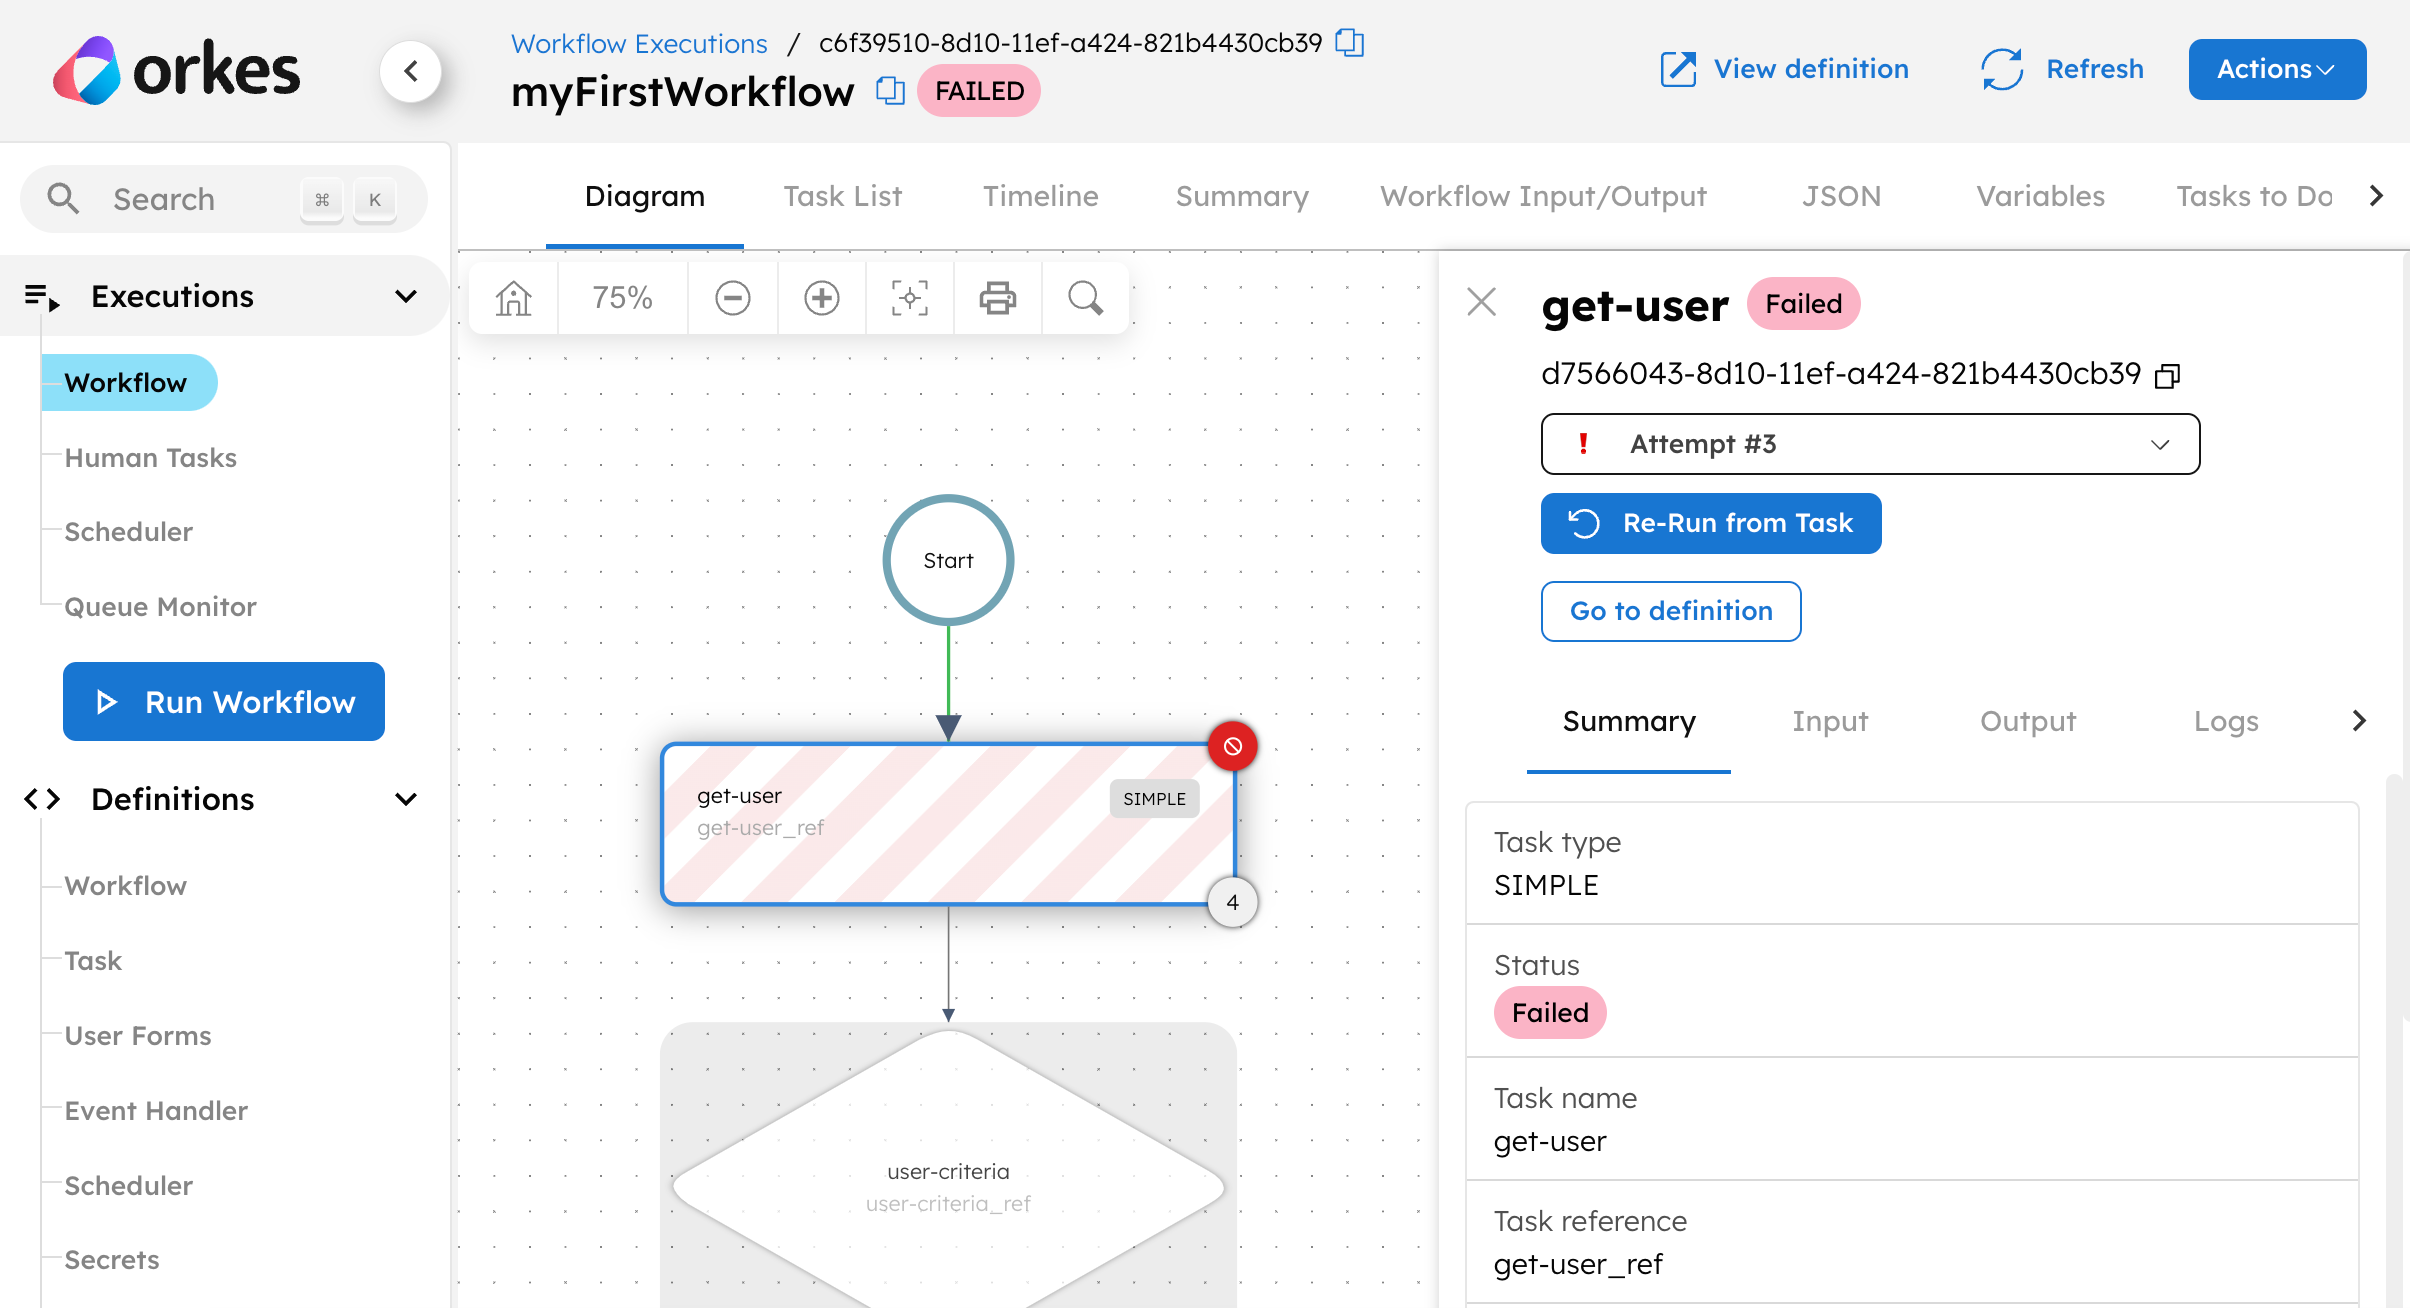
The workflow execution dashboard can be found in Executions > Workflow, where each workflow execution is identified by a unique workflow ID.
Try it out with your workflow
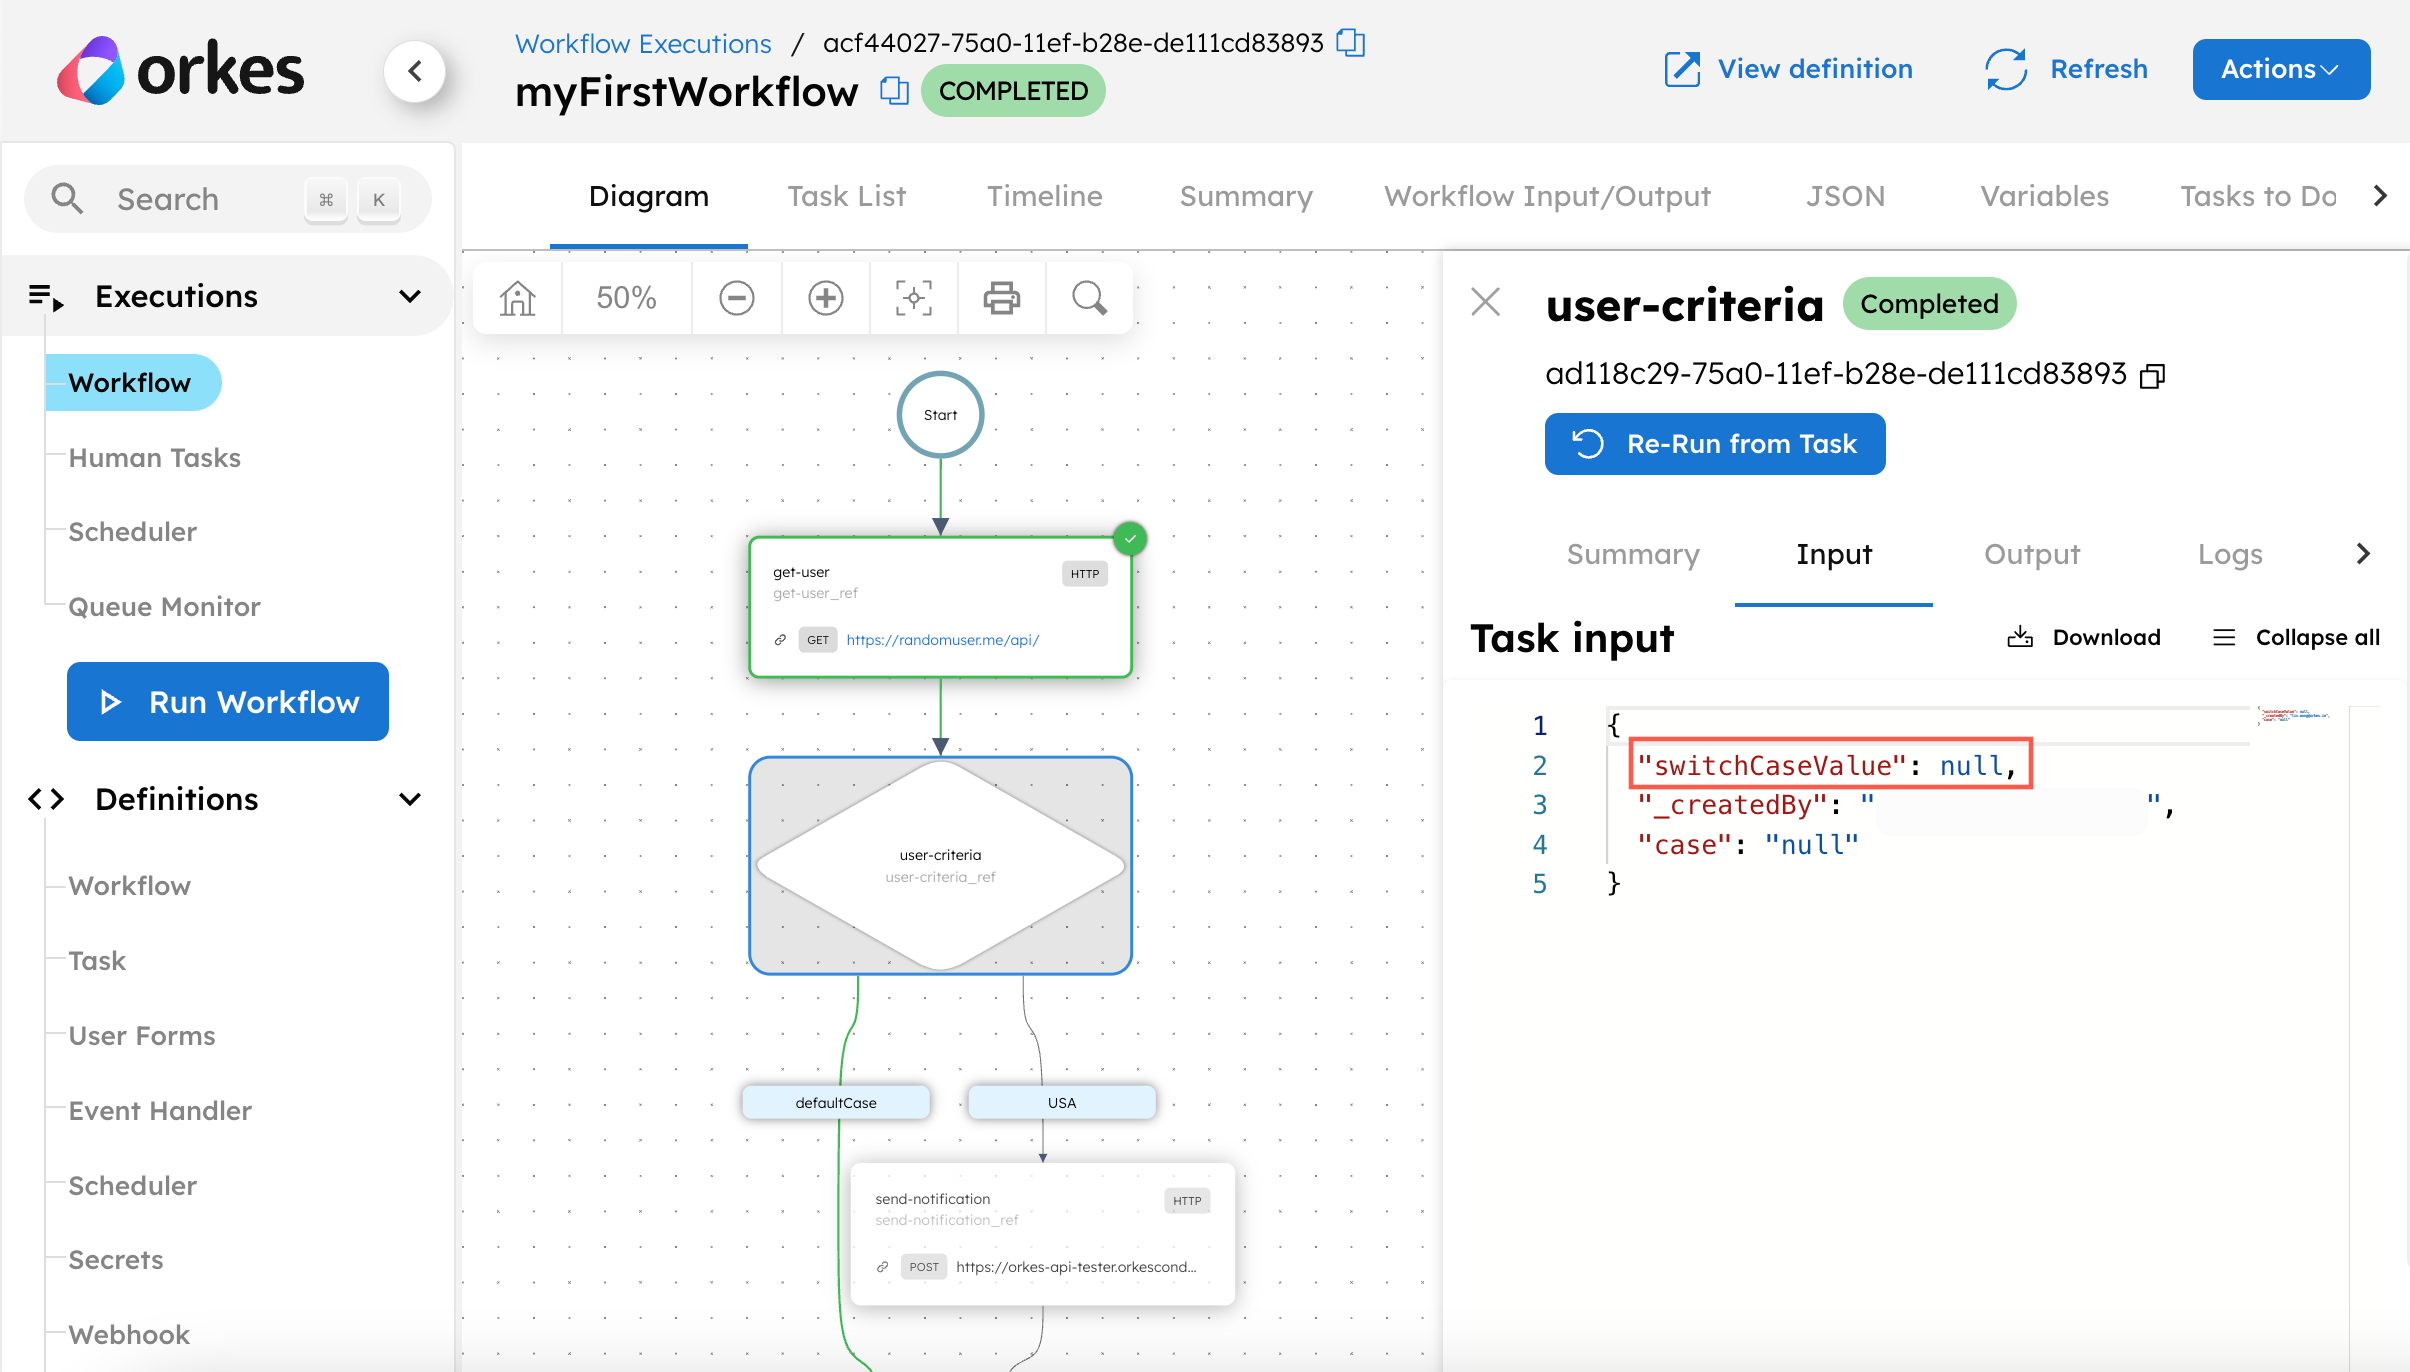
Check out the execution of the helloWorld workflow you’ve just run. If successful, the workflow should have a Completed status, with each task highlighted in green. Otherwise, the workflow diagram will highlight the failed task in red.
However, a workflow can still successfully run to completion, even with the wrong logic. You can check if the data has been correctly passed between tasks by selecting a task, followed by inspecting its Input or Output tab.
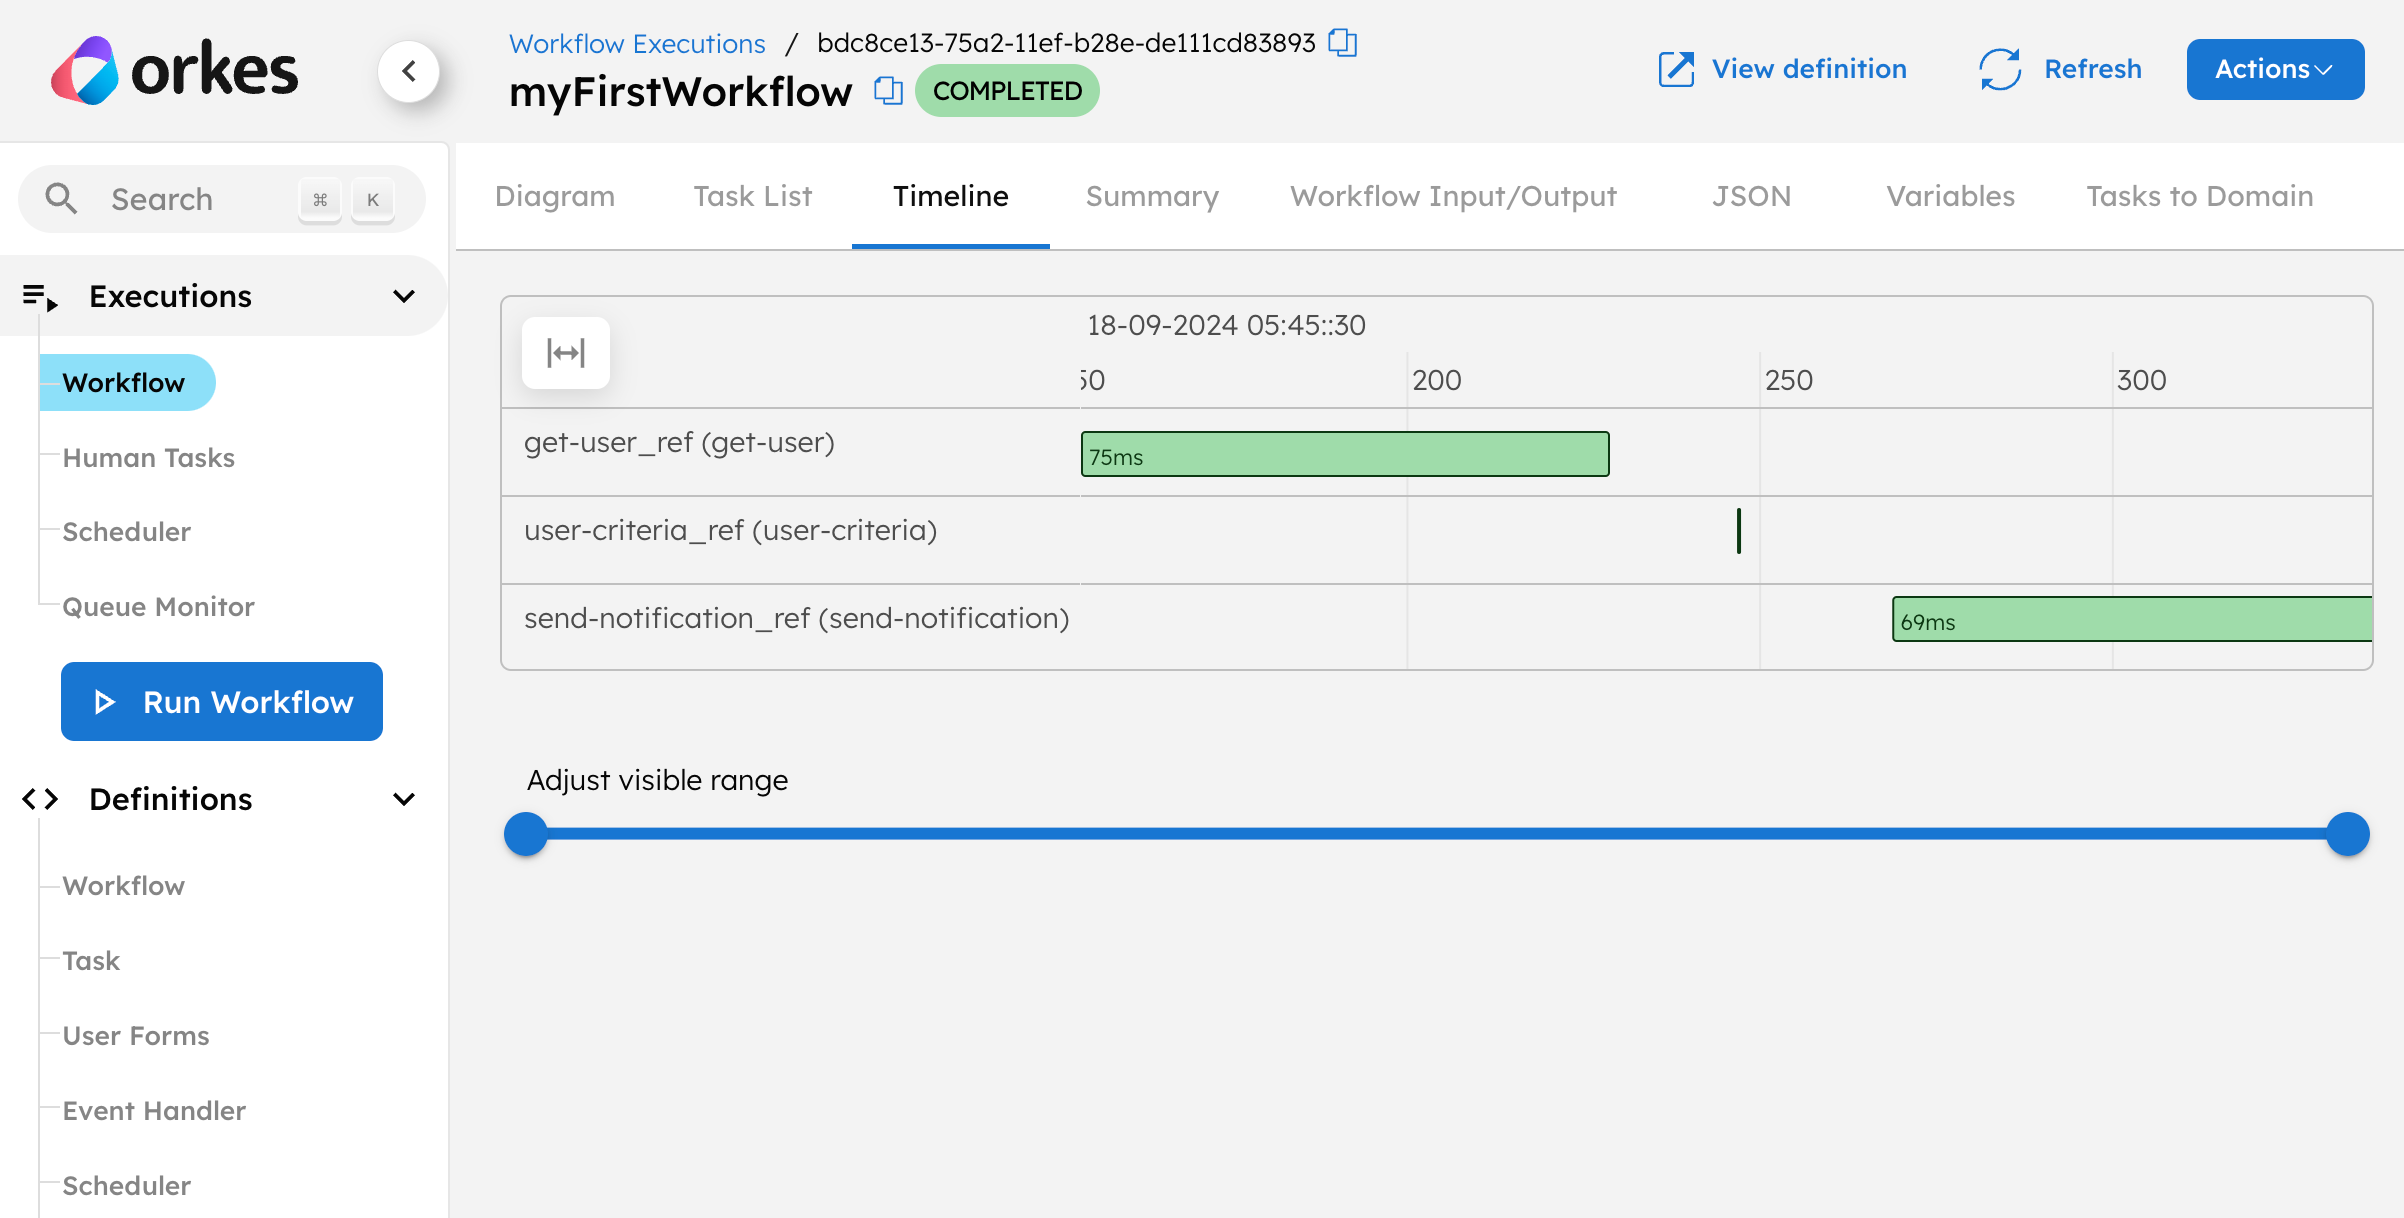
You might also want to know how long each task took to complete, to identify bottlenecks in your execution performance. To inspect this, go to Timeline in the top navigation bar.
With the workflow tested and debugged, it can be deployed to production via code, API, or cron schedules.
What’s next?
Congratulations! You have successfully created, executed, and debugged a Conductor workflow. Gain deeper mastery by exploring each topic in detail:
- Code with Conductor: SDK Guides
- Build more complex workflows using LLM chaining, human-in-workflows, eventing, secrets, and more: Build Workflows
- Run workflows at production scale: Run Workflows
- Debug and monitor workflows using the execution and metrics dashboards: Testing, Monitoring, and Debugging Workflows