SOLUTIONS
Ensuring 99.999% Uptime: Why Service Uptime Monitoring is Crucial

Riza Farheen
Developer Advocate
Last updated: February 25, 2025
February 25, 2025
7 min read


Join thousands of developers building the future with Orkes.
How often have you been frustrated by a website that’s down, taking forever to return online? If it happens too frequently, would you trust that platform again? Probably not.
With businesses running 24/7, downtime is more than just an inconvenience–it’s a direct hit to customer trust and revenue. Studies reveal that businesses can lose thousands of dollars for every hour of downtime. This is why businesses strive for “five-nines” (99.999%) uptime, with an average of less than 6 minutes of downtime annually.
Major outages can bring businesses to a standstill, leading to frustrated customers. This is where uptime monitoring becomes crucial to minimize potential losses. By proactively detecting downtime, businesses can prevent significant disruptions, keep things running smoothly, and build reliable services.
In this blog, we’ll explore why service uptime monitoring is essential for modern businesses and how Orkes Conductor can help implement application flows to monitor HTTP endpoint availability.
Service uptime monitoring is a process of monitoring and managing critical services, such as a website or application, to ensure they remain accessible 24/7.
With continuous monitoring, businesses can receive automated alerts when disruptions occur, allowing them to take immediate action. A robust system can notify relevant team members about any detected downtimes via multiple communication channels, ensuring the right team members can respond promptly.
The demand for fast and reliable online services has always been higher, especially with the growing shift toward digital services. For instance, the increasing trend of digital payments is rapidly replacing traditional cash transactions.
According to Visa Perspective’s Top trends shaping 2025 payments:

The payment industry is just one example of the growing shift toward online services. Industries like e-commerce and others are also witnessing increased consumer demand for digital platforms. As more businesses move toward online services, ensuring uptime monitoring becomes vital. By keeping track of service status, you can identify potential issues—such as outages, performance slowdowns, or errors—before they escalate into major problems.
Here are a few reasons why uptime monitoring is a must for businesses today:
1. Prevent reputation damage
Outages can severely damage your organization’s reputation. Frustrated users experiencing downtime may leave negative reviews, vent on social media, or decide to switch to a competitor.
2. Meet Service Level Agreements (SLAs)
Many businesses establish Service Level Agreements (SLAs) to meet specific performance standards. Failure to detect an outage can lead to missed SLAs, potentially resulting in contract violations and penalties.
3. Minimize loss of revenue
Downtime can directly impact revenue for businesses that rely on online sales and transactions. Customers may be unable to access services or complete purchases, leading to missed sales opportunities.
Consistent service uptime monitoring is essential to overcome these challenges. It ensures your services are quickly restored, minimizing disruptions and enhancing the user experience.
Orkes Conductor, the leading workflow orchestration platform, can be leveraged to build a service uptime monitoring system that fits your business operations. Unlike off-the-shelf monitoring tools, Orkes Conductor gives you full control over uptime checks, allowing you to customize logic to fit your exact business needs. Let’s walk through building the service uptime monitoring flow.
To get started, simply create a free account in Orkes Developer Edition and follow along with the tutorial.
Let’s break down the logic for the service uptime monitoring system:
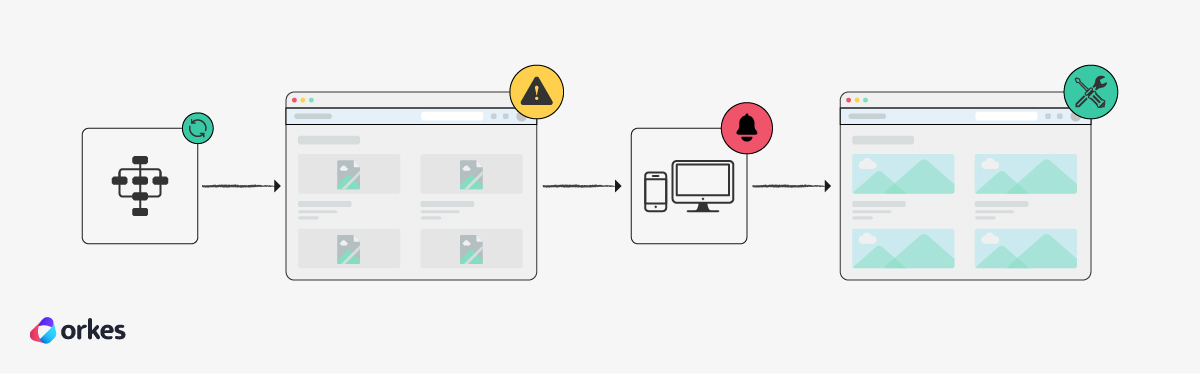
Now, let's build the workflows that will orchestrate this monitoring system. Here’s an overview of the service uptime monitoring system we are going to build:
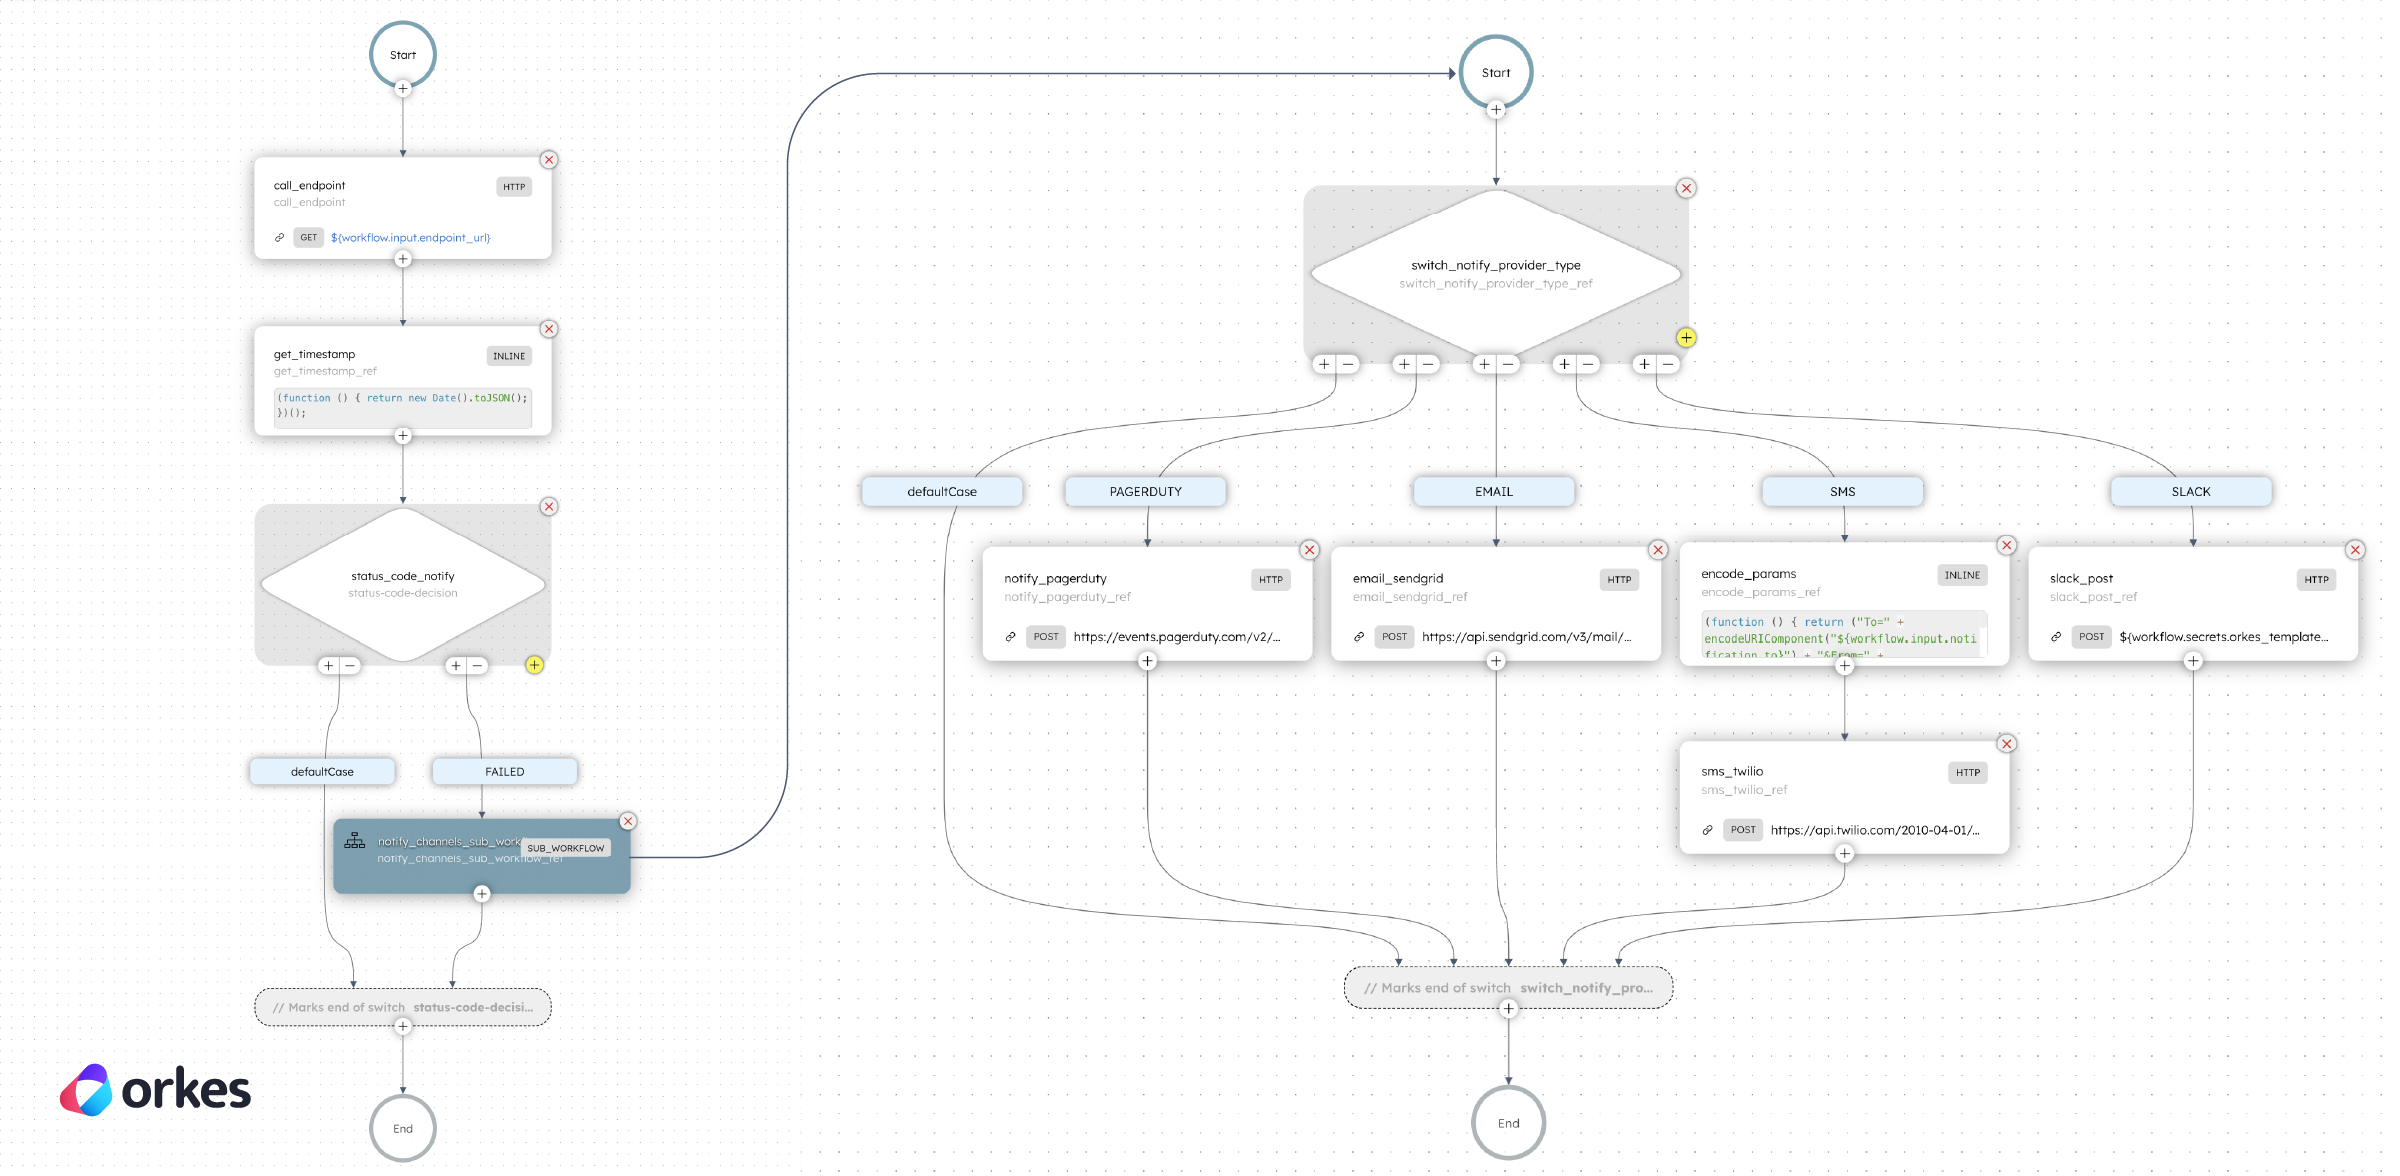
The first part of the service uptime monitoring system checks the endpoint’s availability. This process can be accomplished by creating a Monitor-HTTP-Endpoint-Availability workflow.
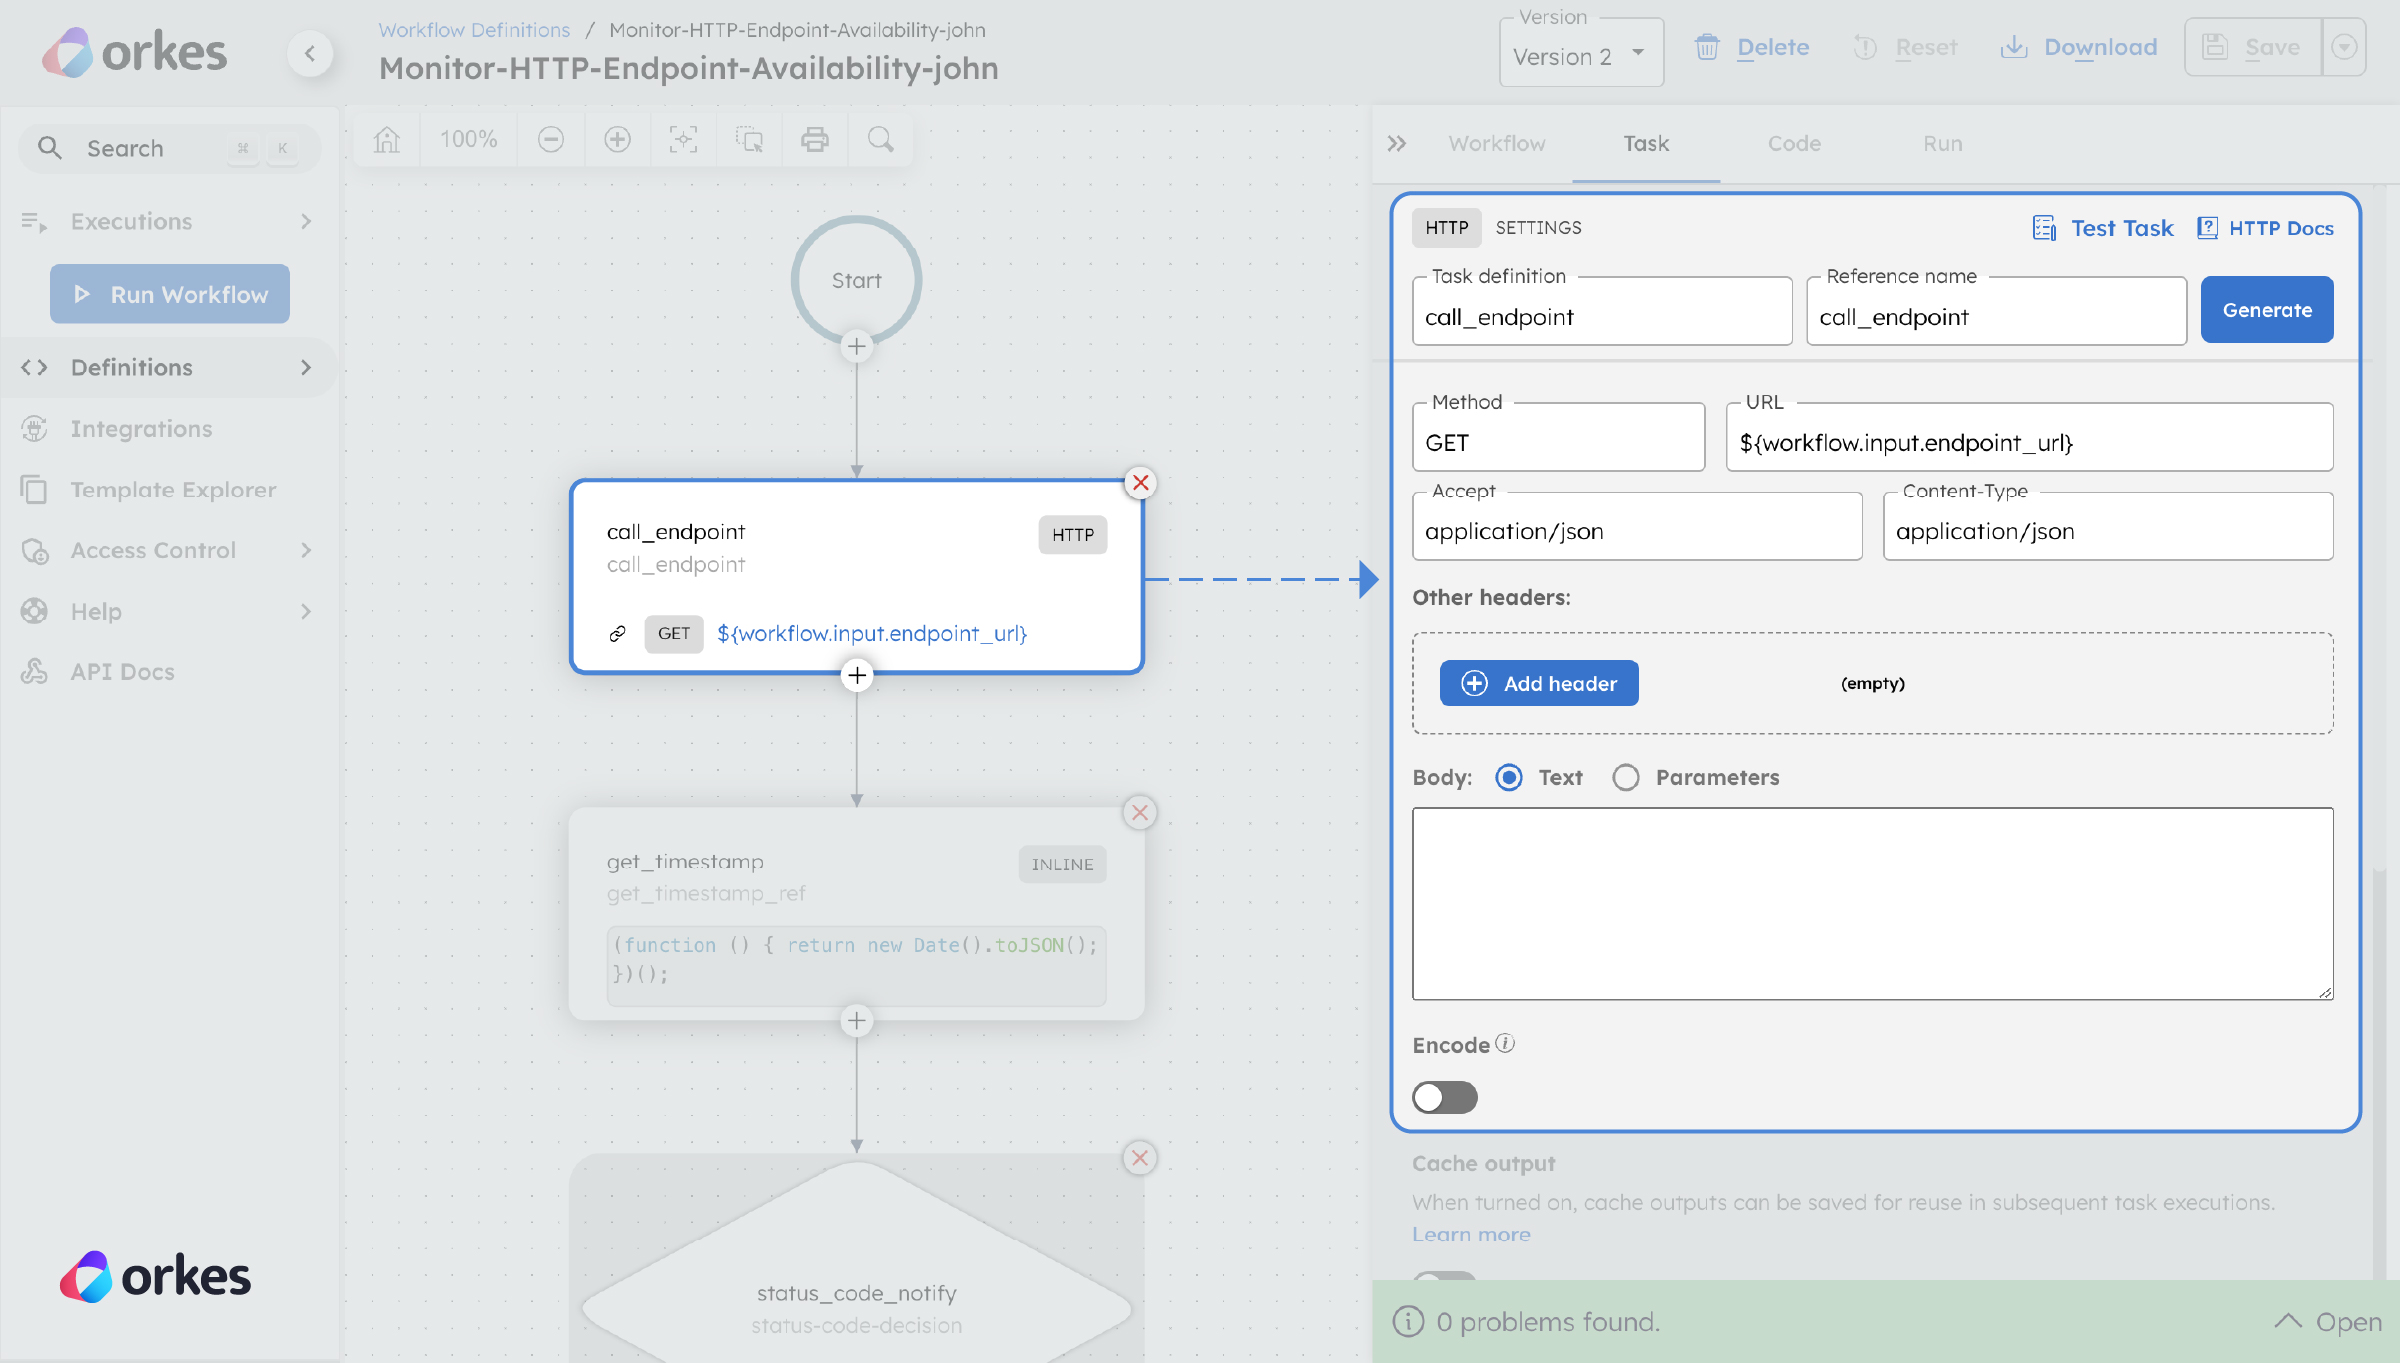
The first step is to check if the HTTP(s) endpoints are available. To check the availability, create an HTTP task in your Conductor workflow. Configure the endpoint method, URL, and other parameters. When the workflow is executed, it will call the endpoint and retrieve the response.
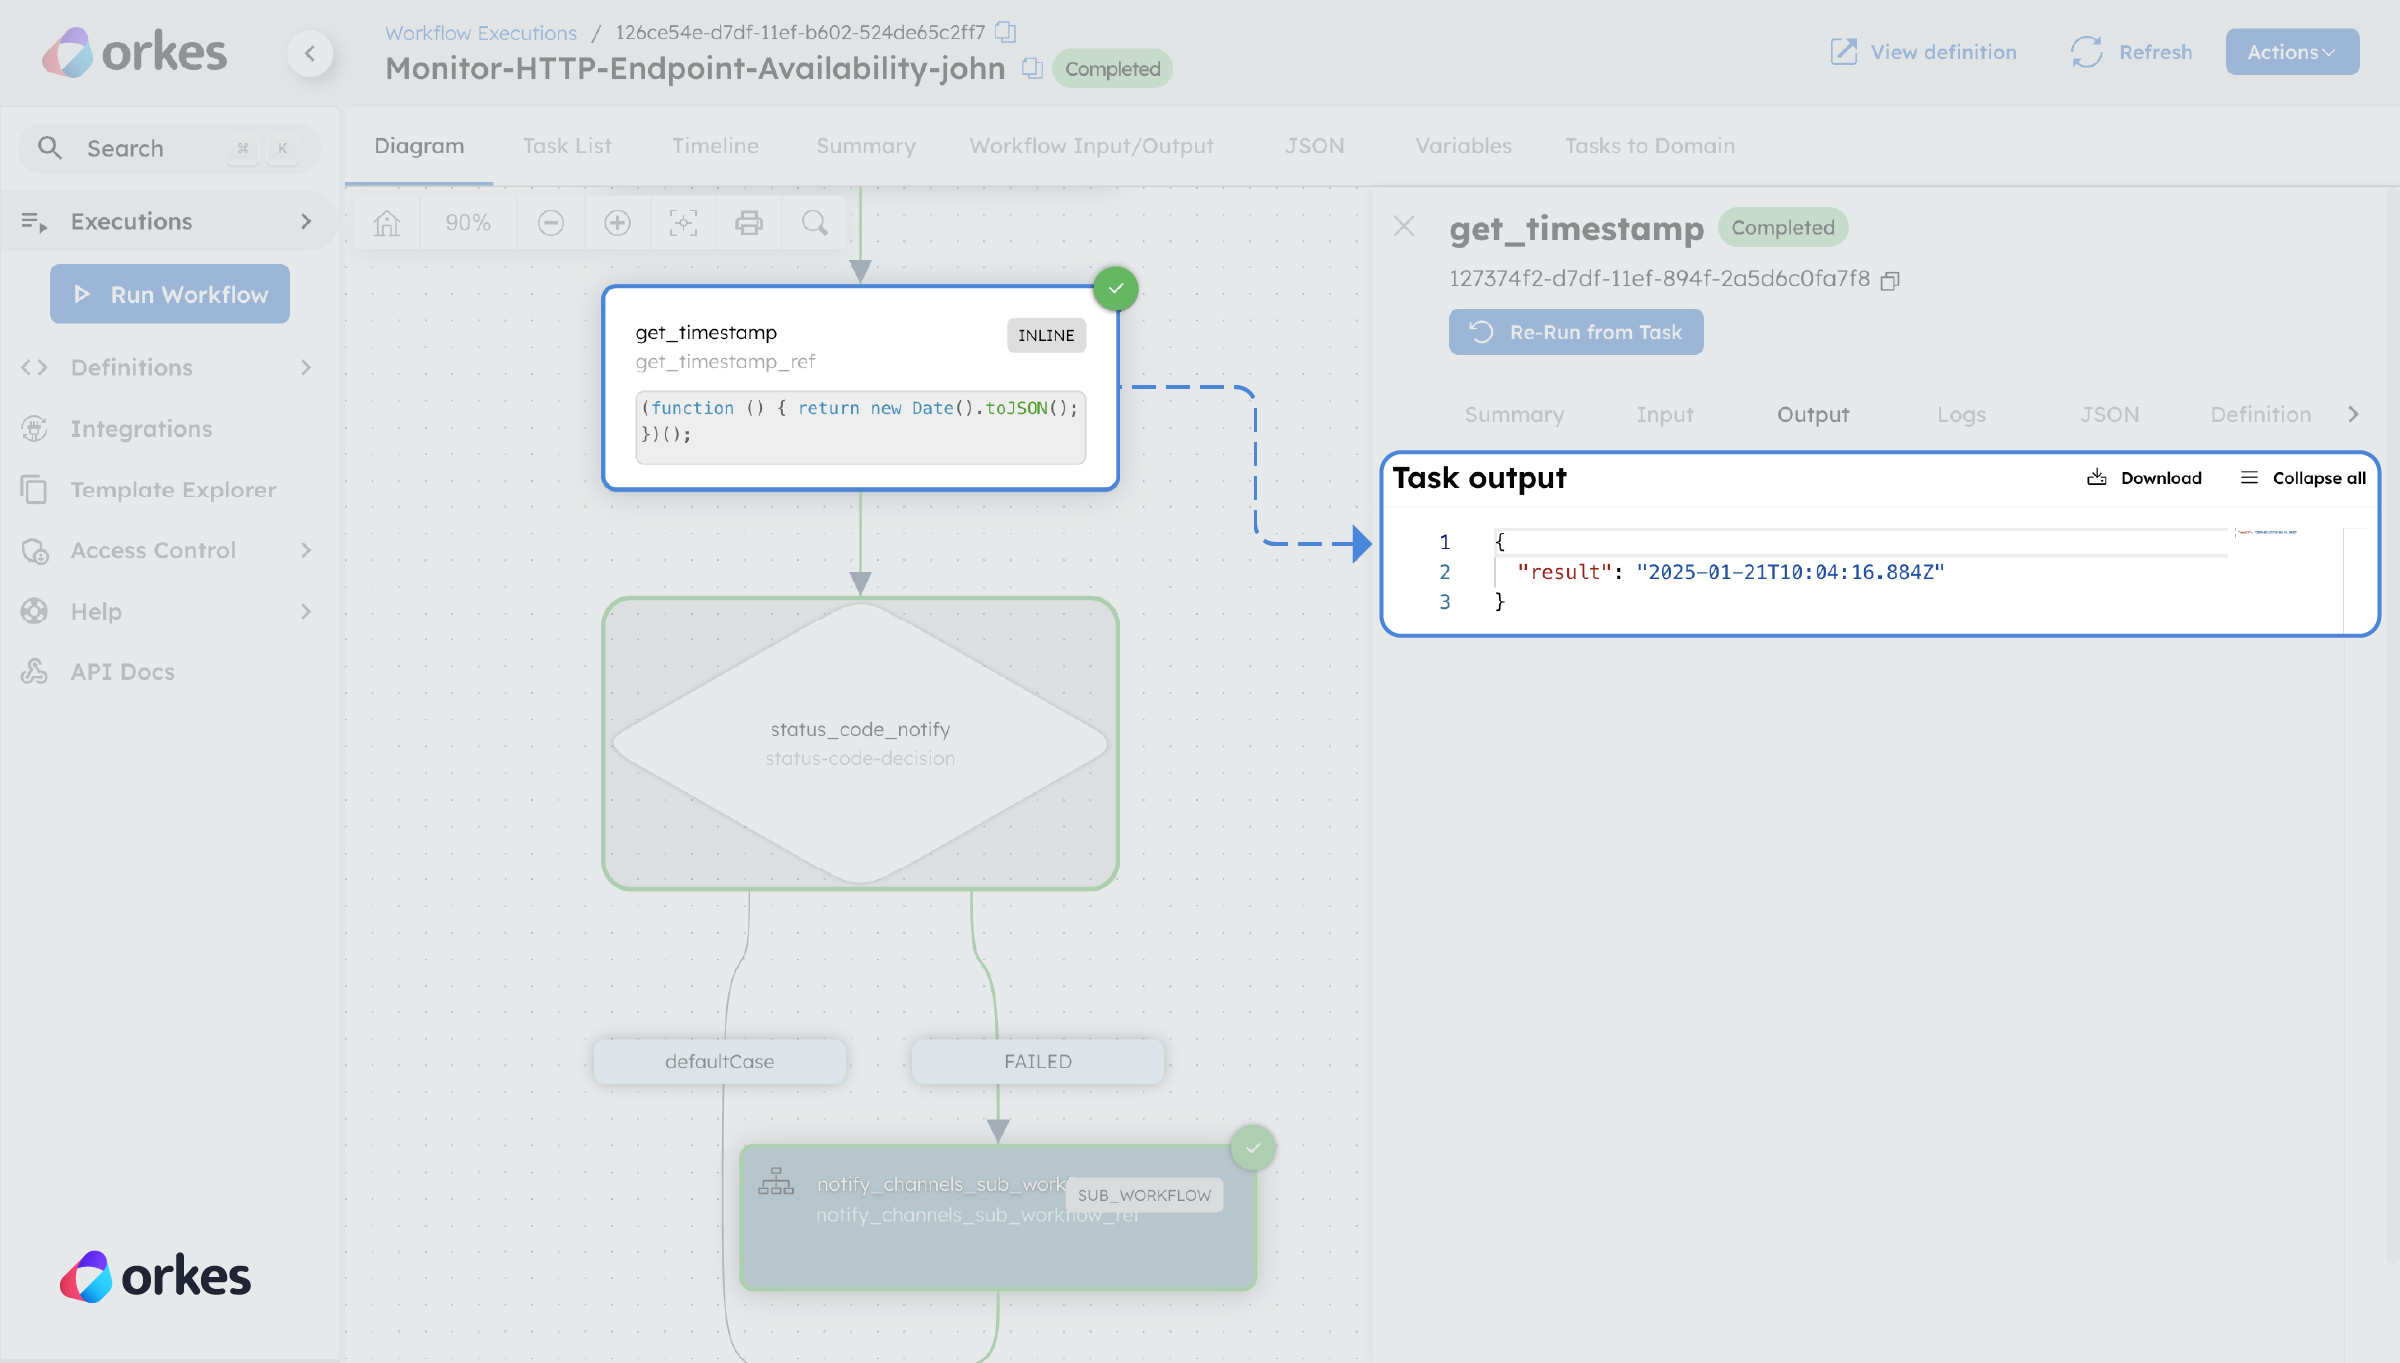
If the server is down, it’s essential to know when the downtime was detected. To achieve this, use an Inline task that extracts the timestamp when the response was received.
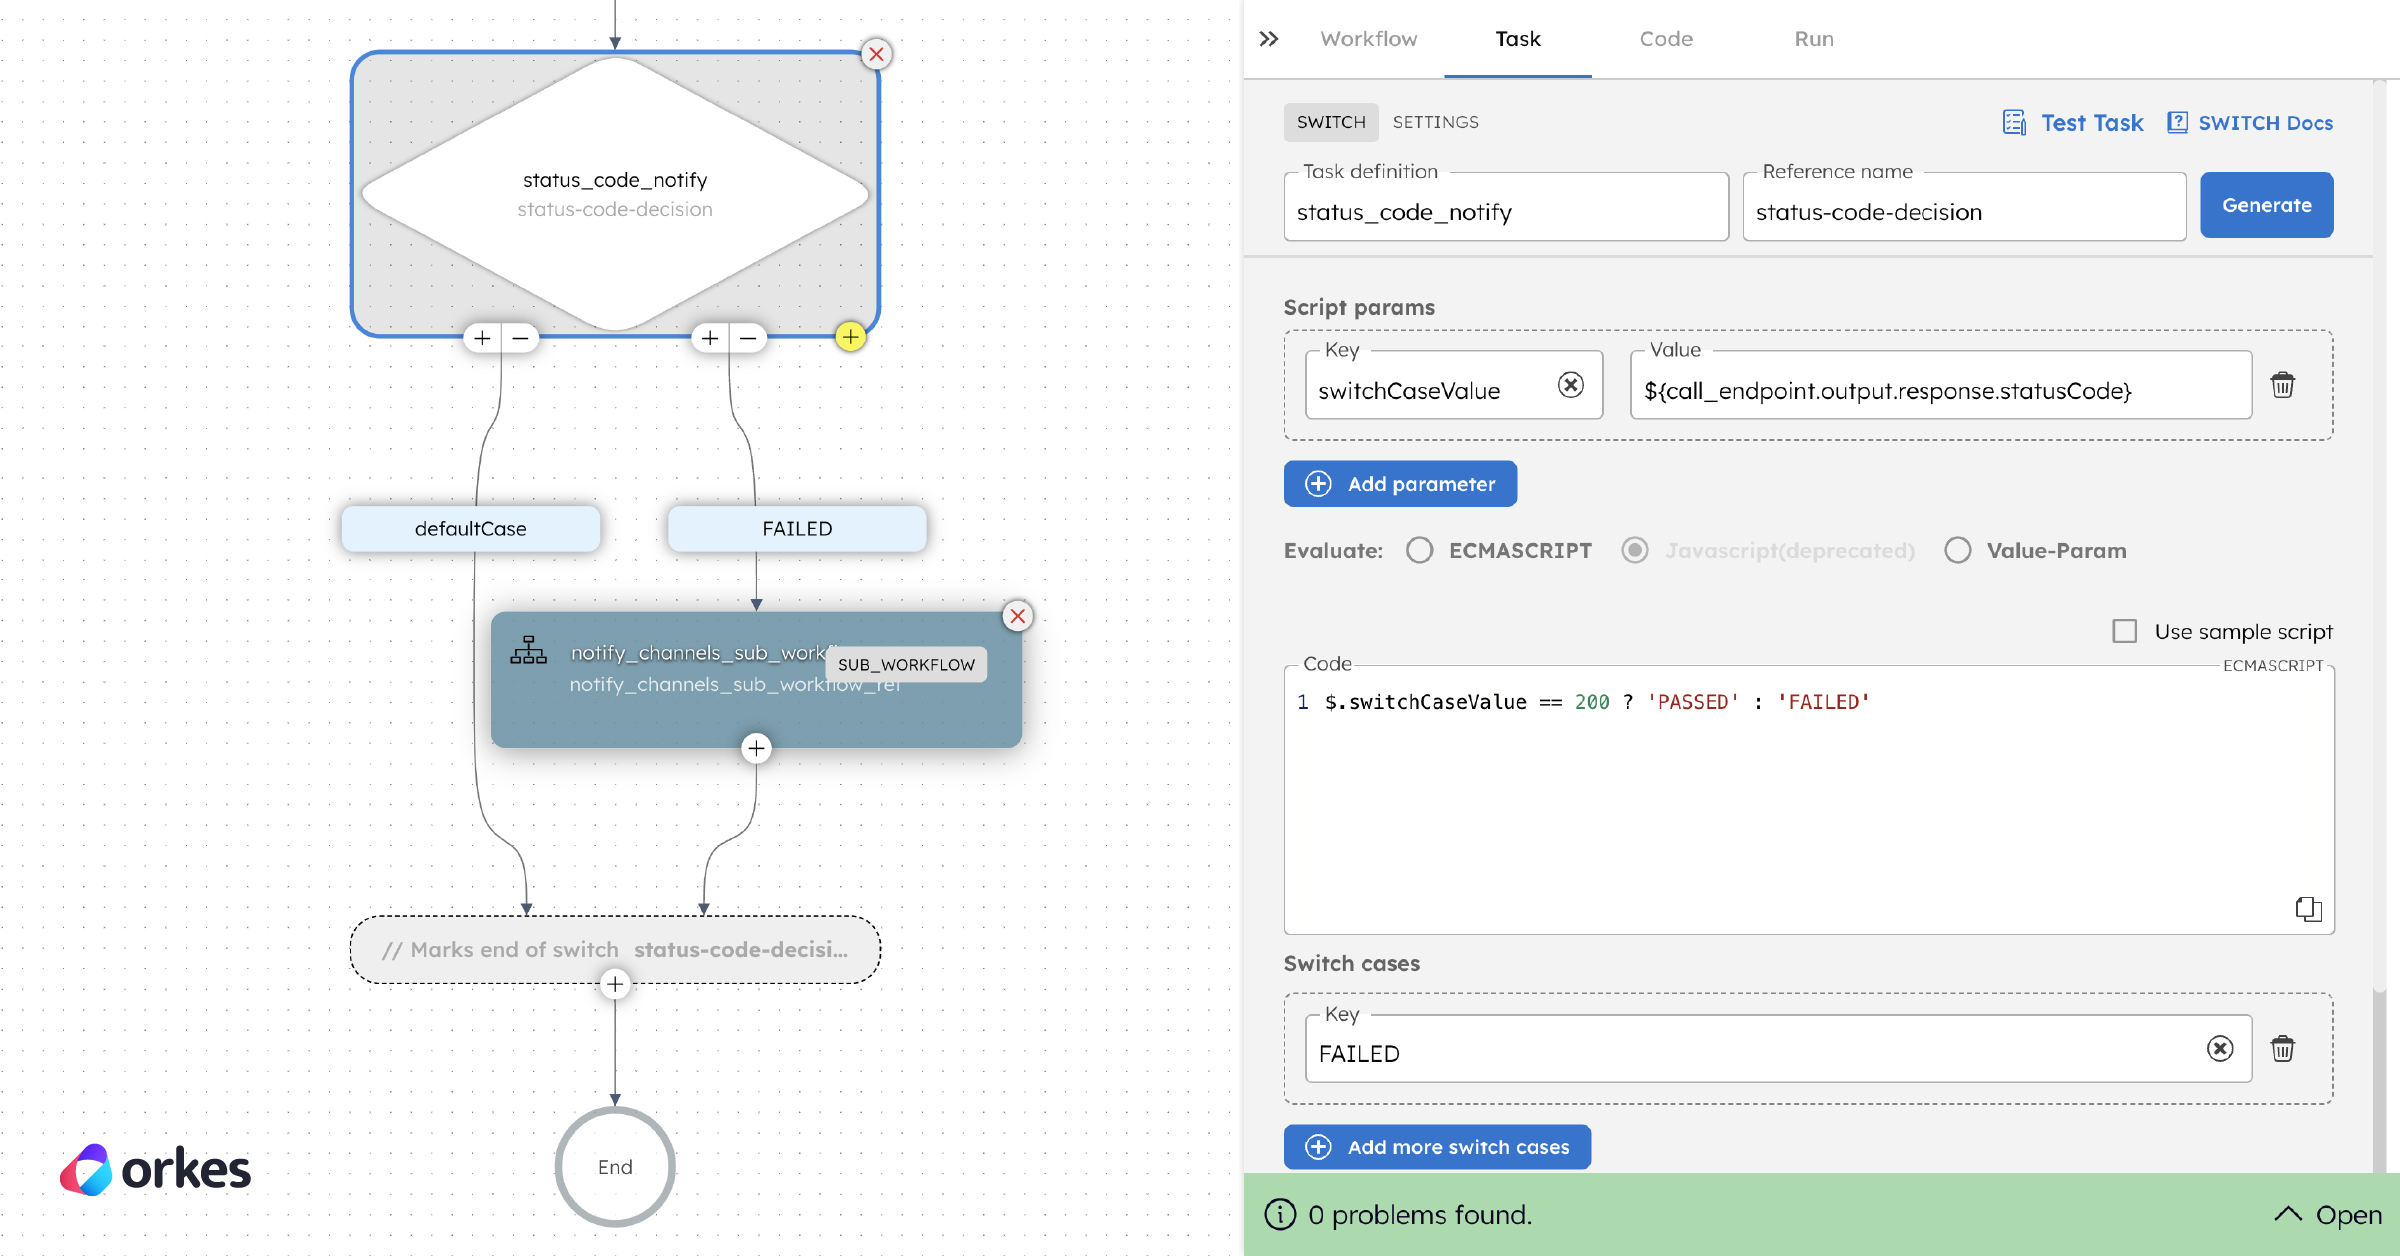
Use the Switch task in your Conductor workflow to evaluate the response from the HTTP task. If the response indicates success, the workflow will terminate. If failure is detected, the workflow will proceed to the next part, which involves notifying the appropriate team.
The sample workflow input includes the notification method (e.g., SMS), the endpoint URL to be monitored, and the sender/receiver information for notifications.
{
  "notification_type": "SMS",
  "endpoint_url": "https://example.com/",
  "notification_from": "14XXXXXXXXX",
  "notification_to": "12XXXXXXXX"
}
Here is the workflow definition for Monitor-HTTP-Endpoint-Availability workflow. To create the workflow, go to Definitions > Workflow in the Developer Edition.
Select + Define workflow and paste the following code in the Code tab:
{
 "name": "Monitor-HTTP-Endpoint-Availability",
 "description": "Ping a URL for uptime check and notify multiple if its down",
 "version": 2,
 "tasks": [
   {
     "name": "call_endpoint",
     "taskReferenceName": "call_endpoint",
     "inputParameters": {
       "http_request": {
         "uri": "${workflow.input.endpoint_url}",
         "method": "GET",
         "connectionTimeOut": 3000,
         "readTimeOut": 3000
       }
     },
     "type": "HTTP"
   },
   {
     "name": "get_timestamp",
     "taskReferenceName": "get_timestamp_ref",
     "inputParameters": {
       "expression": "(function () { return new Date().toJSON(); })();",
       "evaluatorType": "javascript"
     },
     "type": "INLINE"
   },
   {
     "name": "status_code_notify",
     "taskReferenceName": "status-code-decision",
     "inputParameters": {
       "switchCaseValue": "${call_endpoint.output.response.statusCode}"
     },
     "type": "SWITCH",
     "decisionCases": {
       "FAILED": [
         {
           "name": "notify_channels_sub_workflow",
           "taskReferenceName": "notify_channels_sub_workflow_ref",
           "inputParameters": {
             "notification_message": "Monitor-HTTP-Endpoint-Availability notification from Orkes Conductor: ${workflow.input.endpoint_url} is down. Timestamp: ${get_timestamp_ref.output.result} .",
             "notification_type": "${workflow.input.notification_type}",
             "notification_from": "${workflow.input.notification_from}",
             "notification_to": "${workflow.input.notification_to}"
           },
           "type": "SUB_WORKFLOW",
           "subWorkflowParam": {
             "name": "Notify-Channels"
           }
         }
       ]
     },
     "defaultCase": [],
     "evaluatorType": "javascript",
     "expression": "$.switchCaseValue == 200 ? 'PASSED' : 'FAILED'"
   }
 ],
 "inputParameters": [
   "endpoint_url",
   "notification_type",
   "notification_to",
   "notification_from"
 ],
 "outputParameters": {
   "statusCode": "${call_endpoint.output.response.statusCode}"
 },
 "schemaVersion": 2
}
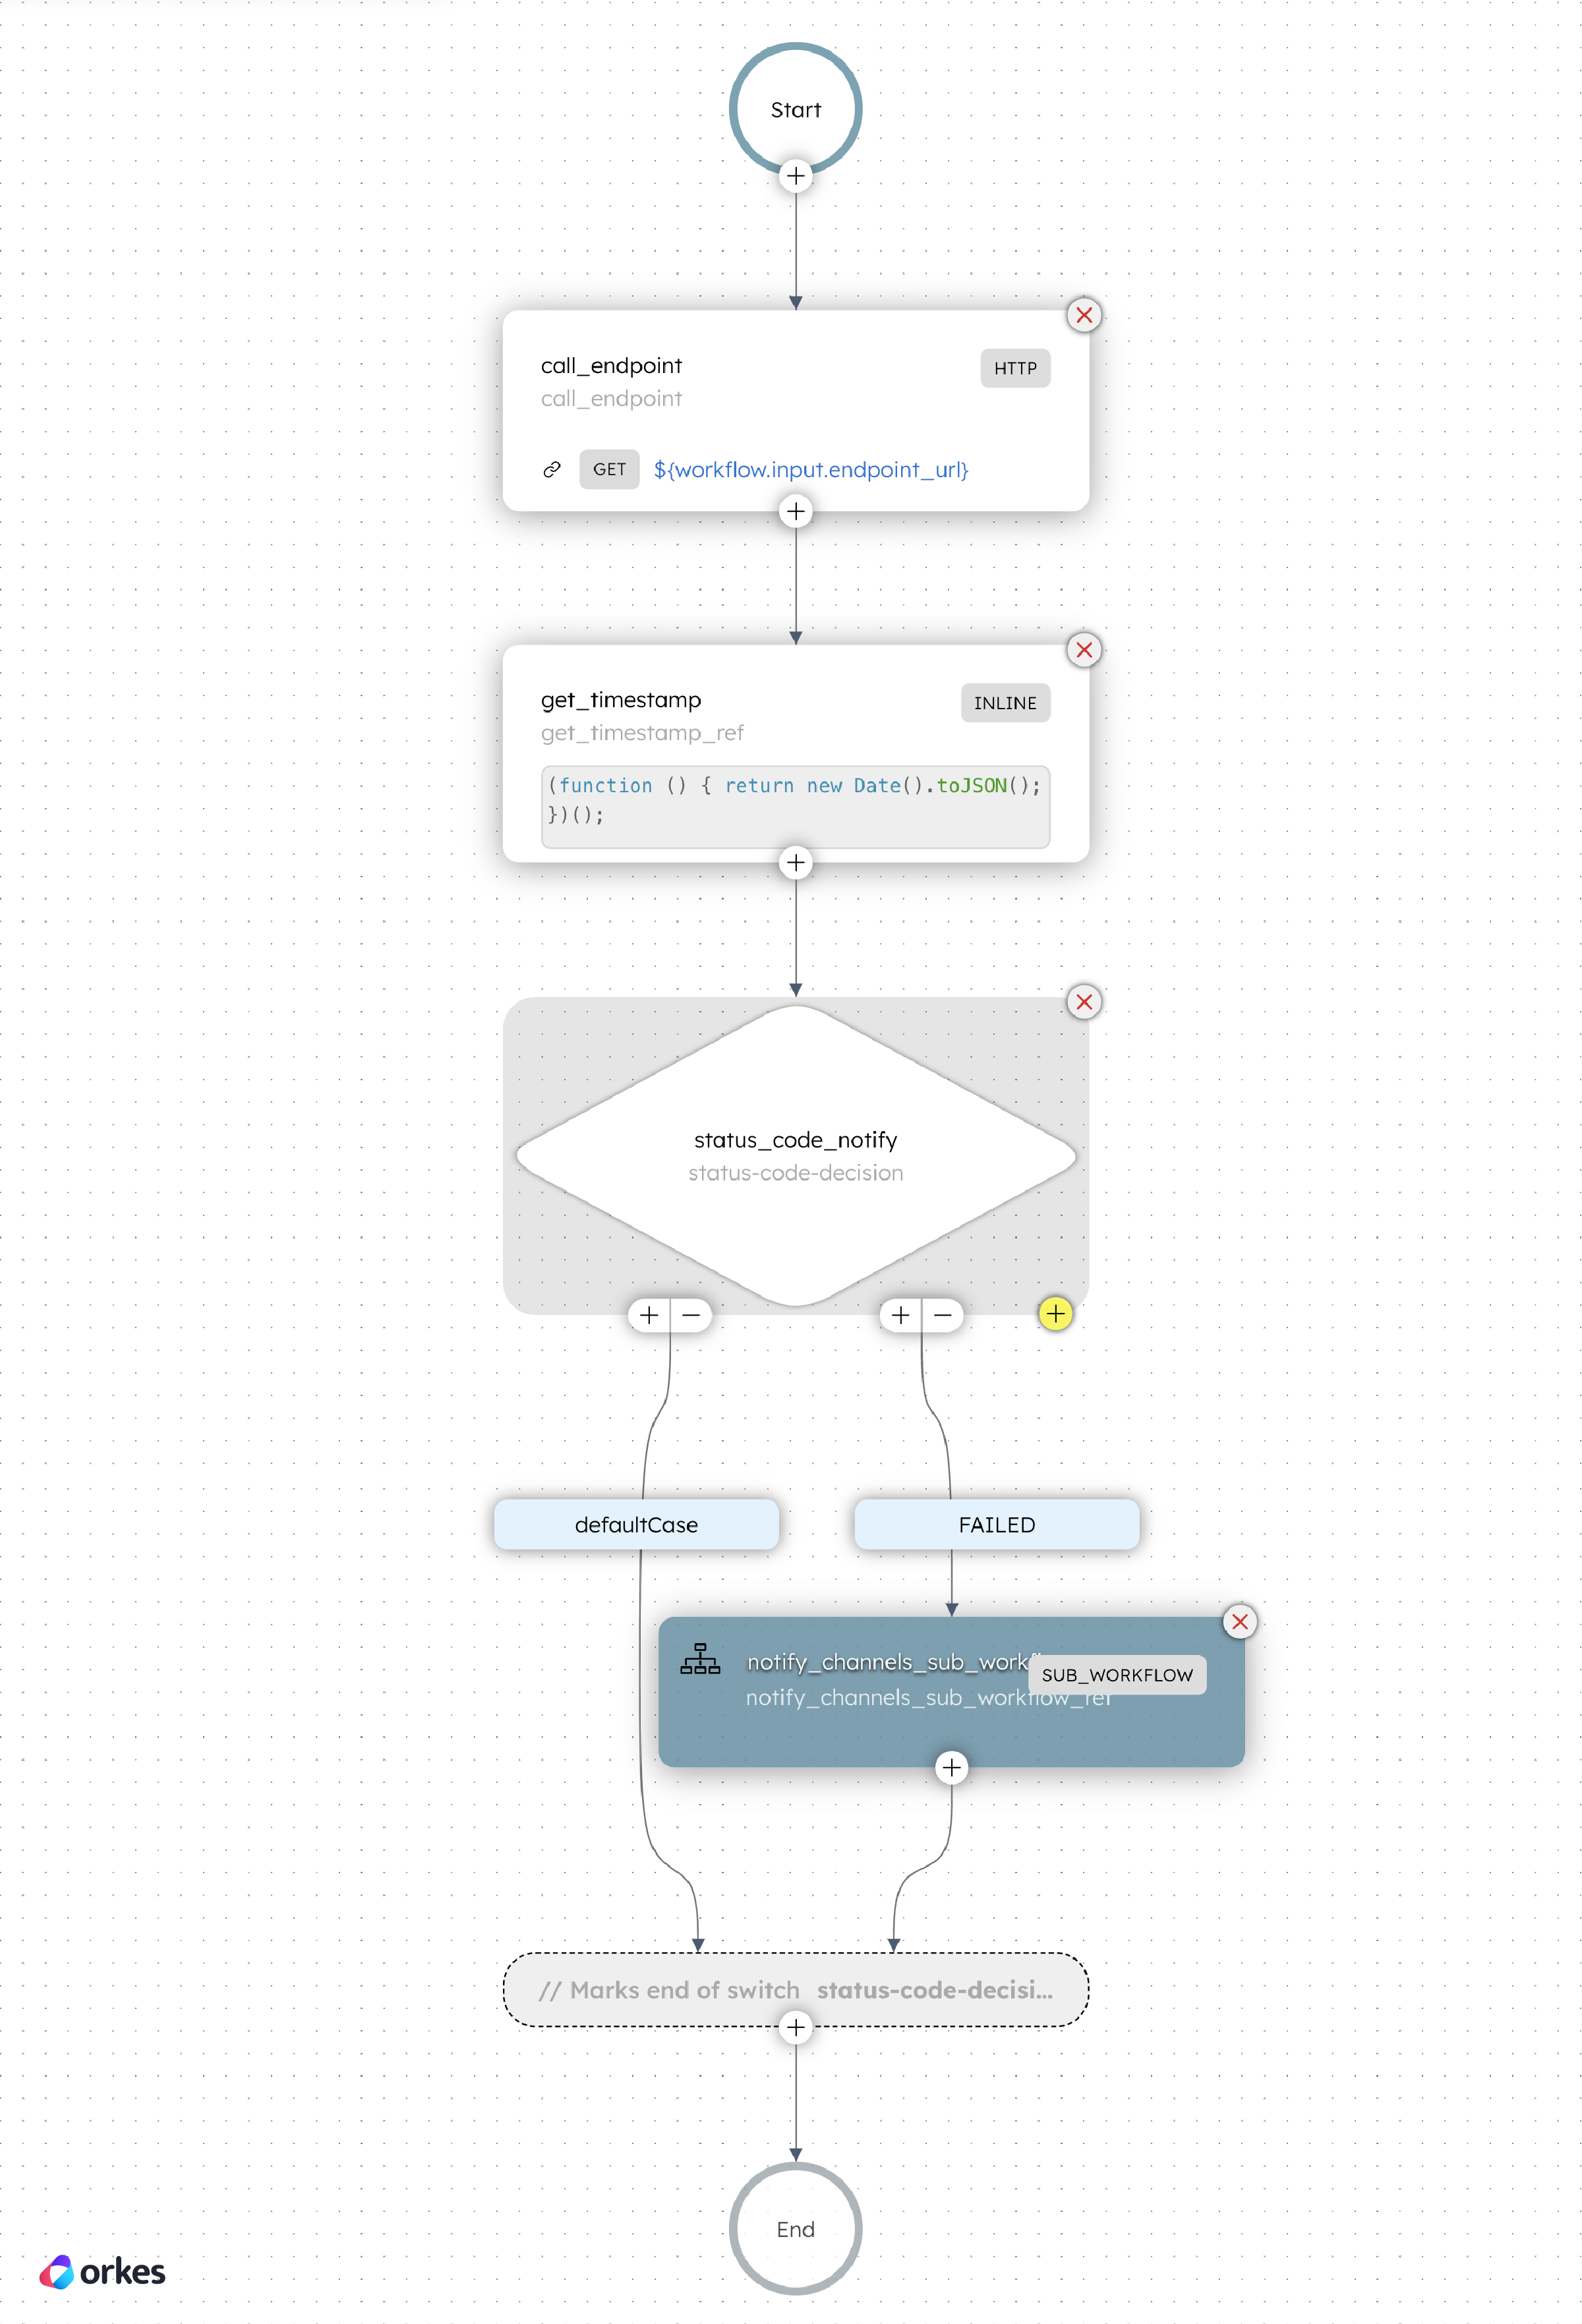
Save the workflow. Your workflow looks like this:
The sample workflow input includes the notification method, the endpoint URL to be monitored, and the sender/receiver information for notifications.
{
  "notification_type": "<NOTIFICATION-TYPE>", Supports EMAIL,SMS, SLACK OR PAGERDUTY.
  "endpoint_url": "<YOUR-ENDPOINT-URL>",
  "notification_from": "14XXXXXXXXX", // for SMS or EMAIL only
  "notification_to": "12XXXXXXXX" // for SMS or EMAIL only
}
In the above workflow, the notification step is incorporated as a Sub Workflow, which facilitates best practices in modularization.
Sub Workflows in Conductor simplifies workflow management, making it easy to reuse common workflows across multiple processes.
The notification system is a typical flow within an organization when building applications. Creating a dedicated workflow for your organization’s notification system that integrates all notification methods allows you to easily adapt your notification flow to different application processes using the Sub Workflow functionality in Conductor.
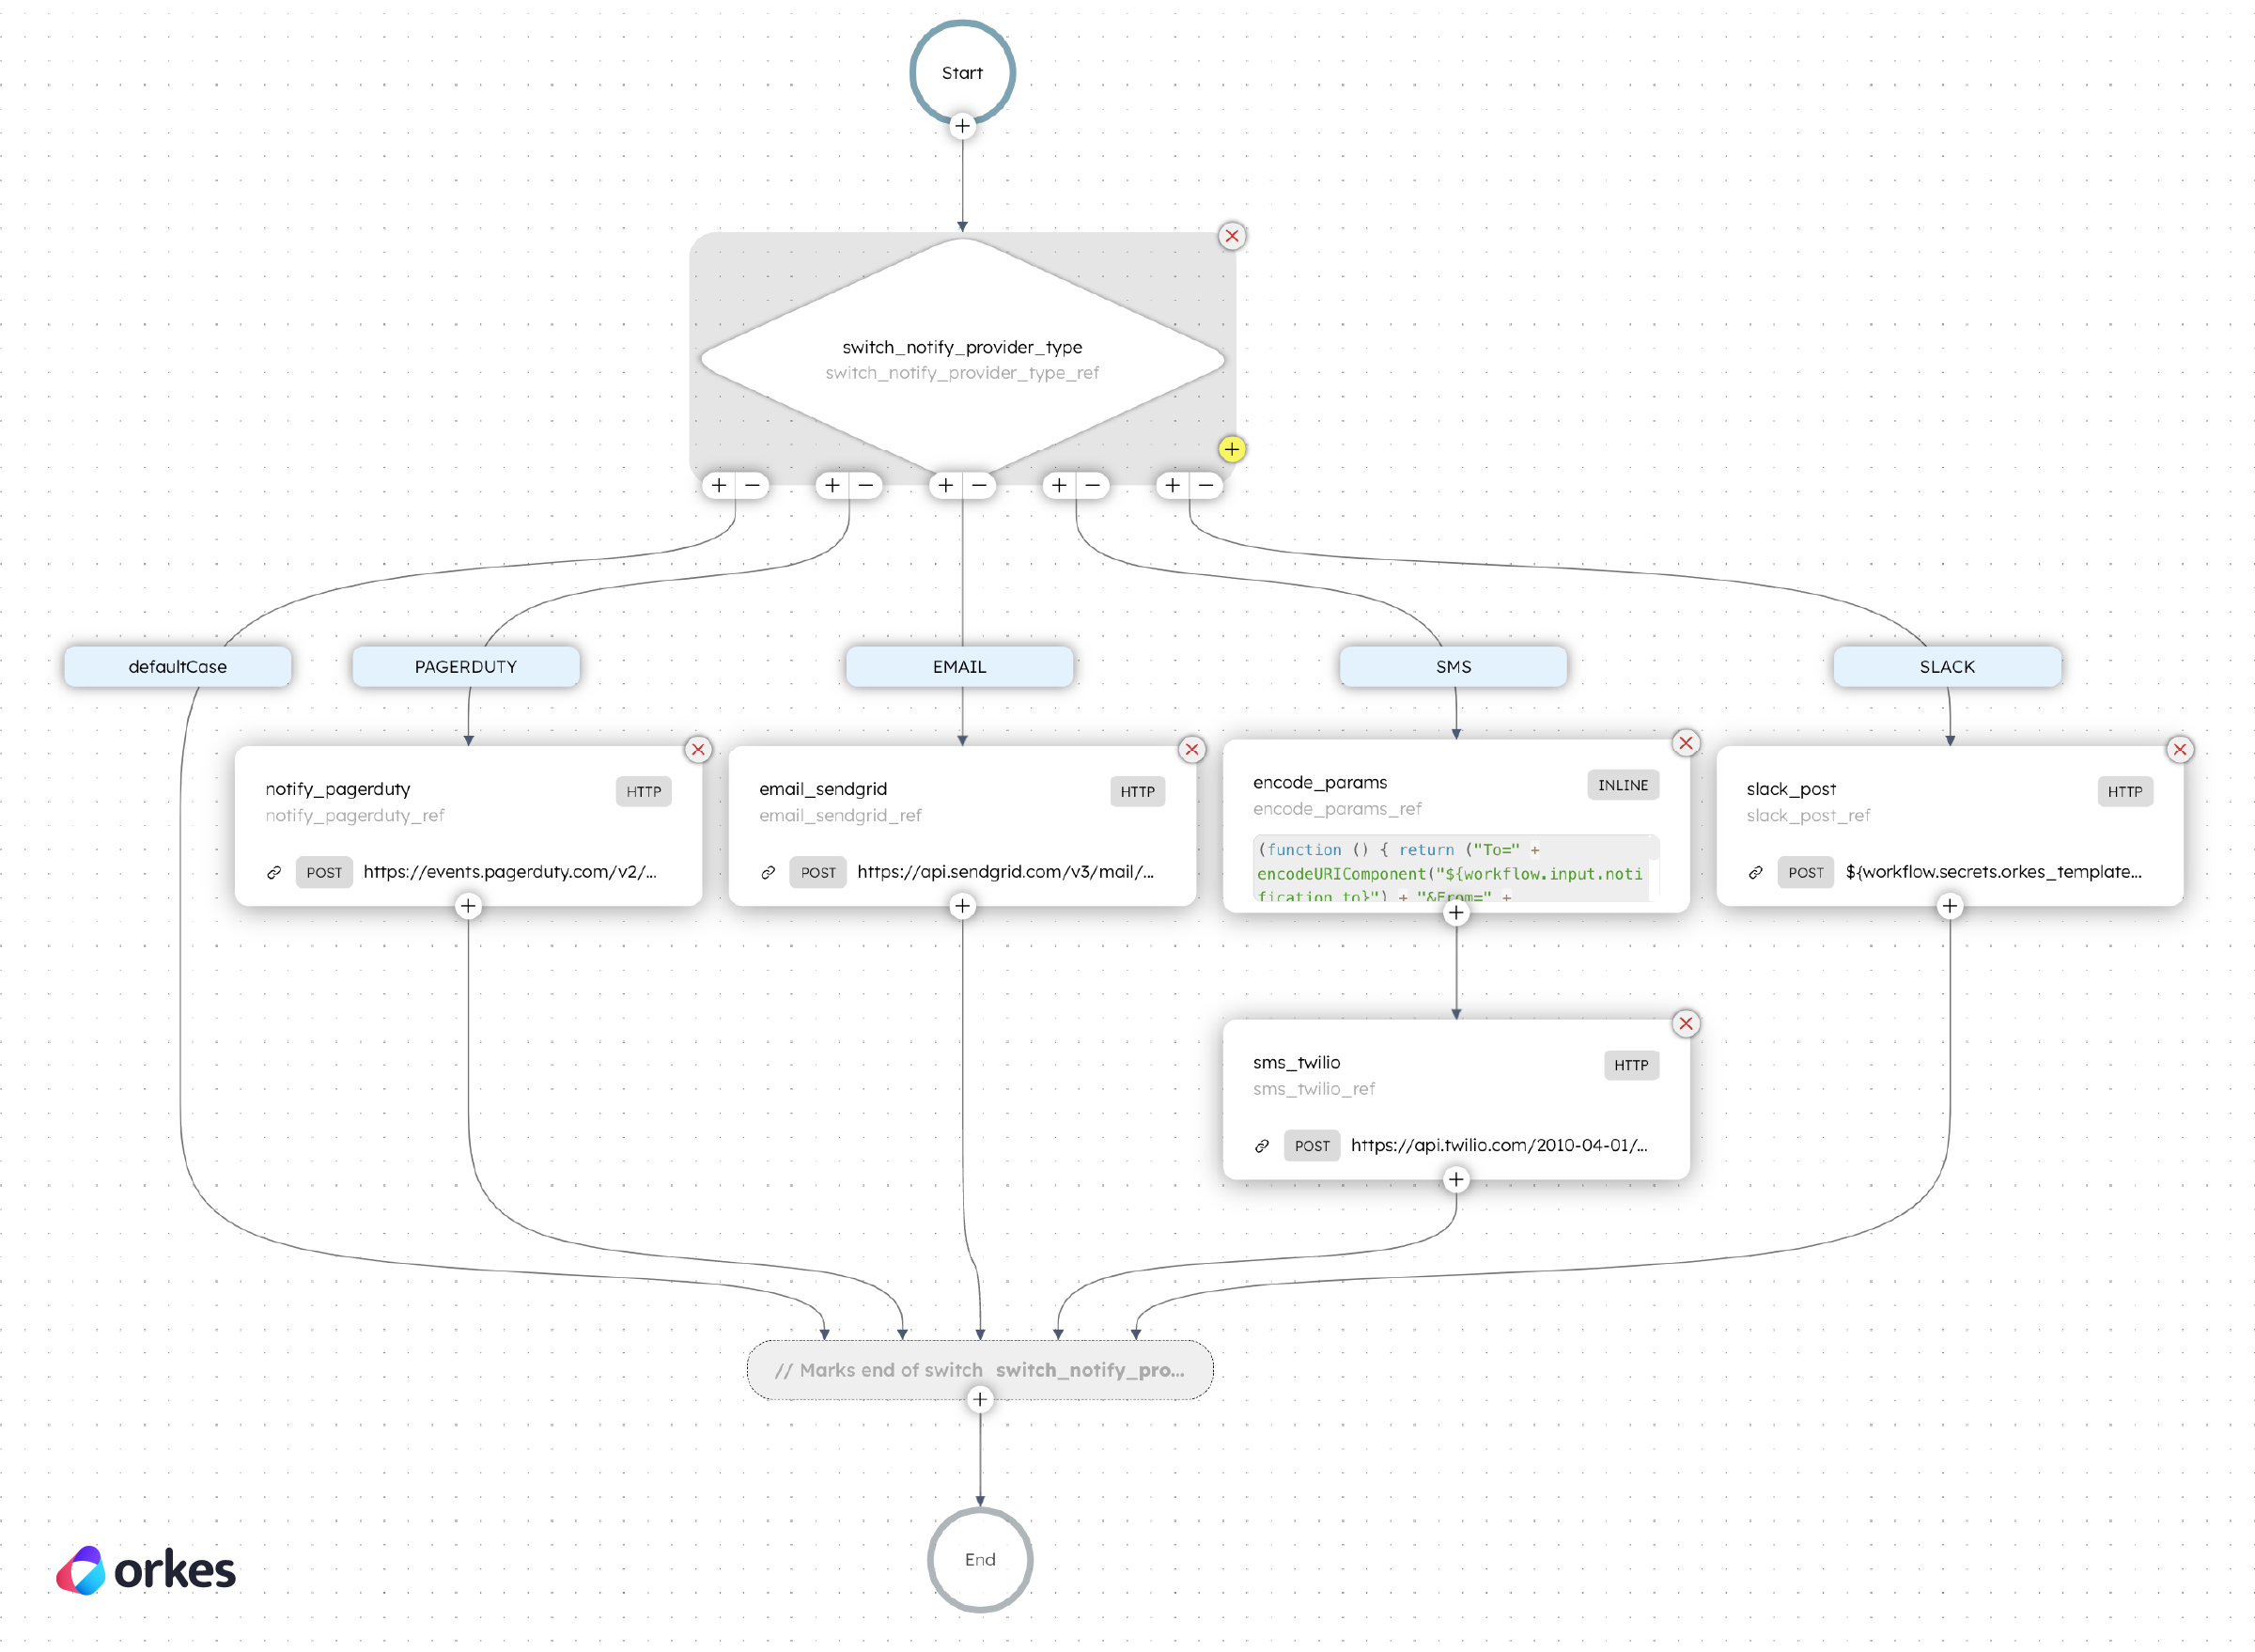
Once the endpoint is monitored and downtime is detected, the next part is to notify the corresponding team members to take action. This is where the second part of the application flow is to be implemented. For this second part, let’s build a Notify-Channels workflow that sends notifications via the preferred channel.
Let's add a Switch task to a new workflow to assess the input and determine the preferred notification method.
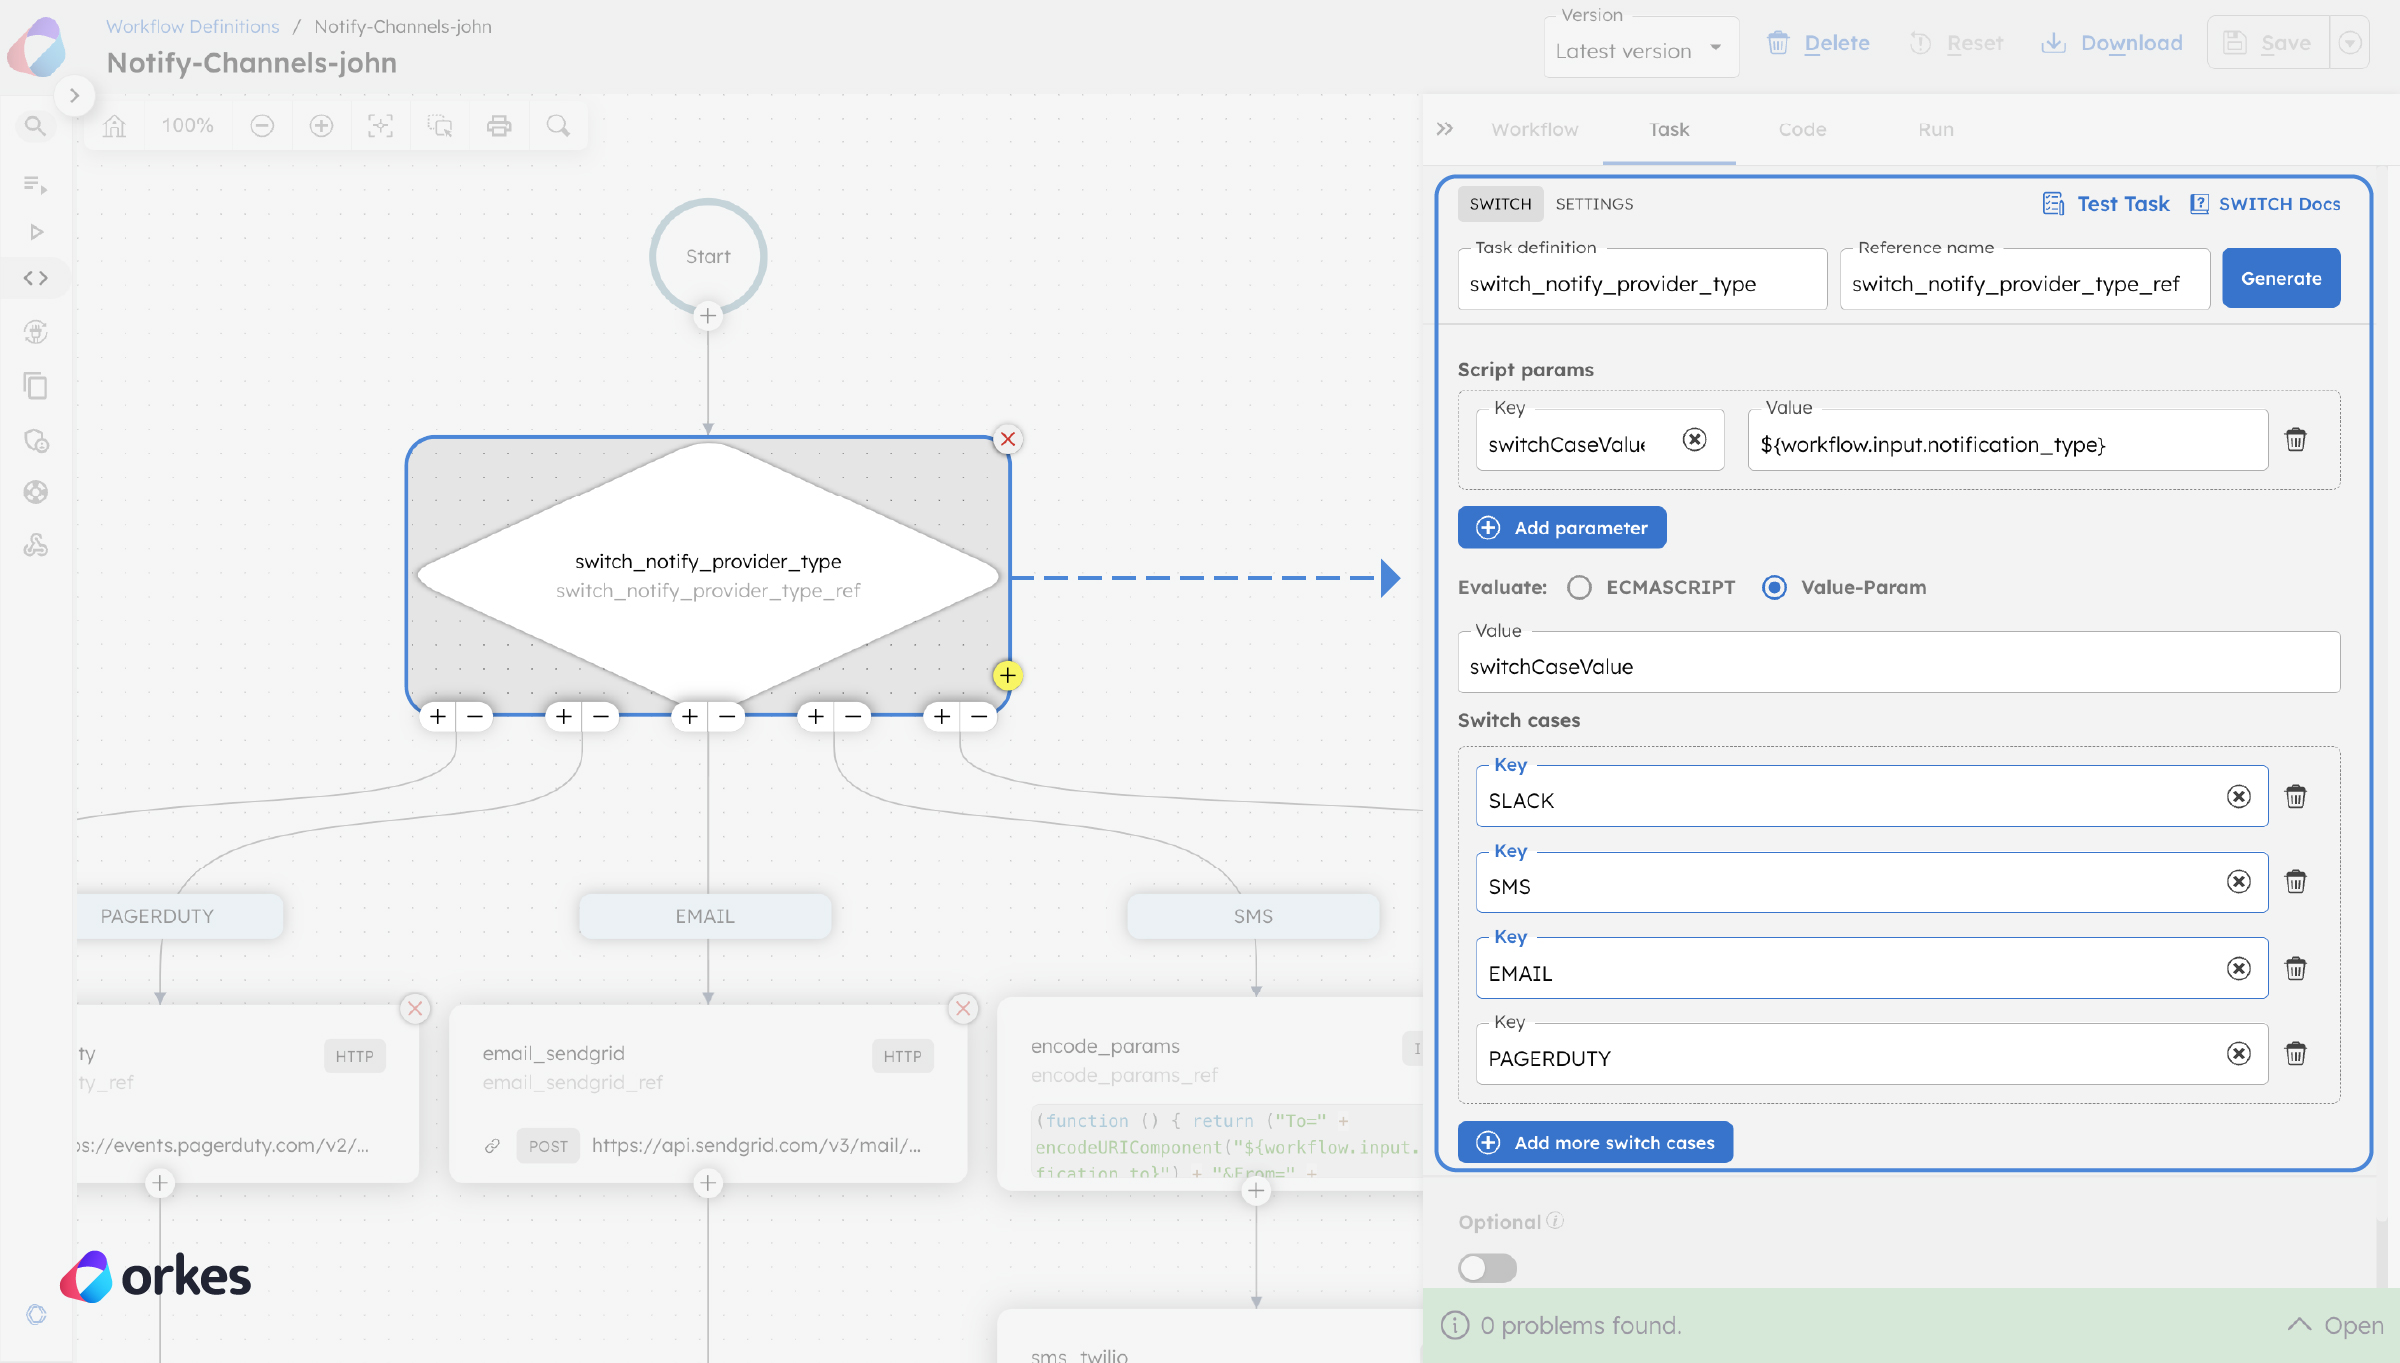
The Switch task evaluates the main workflow input and proceeds along the appropriate path.
With the chosen notification type, the next step is to send the service downtime alert through the selected channel. In this workflow, we’ve defined four cases: SMS, email, Slack, and PagerDuty.
Here’s an example of a flow that sends notifications via SMS using Twilio as the provider.
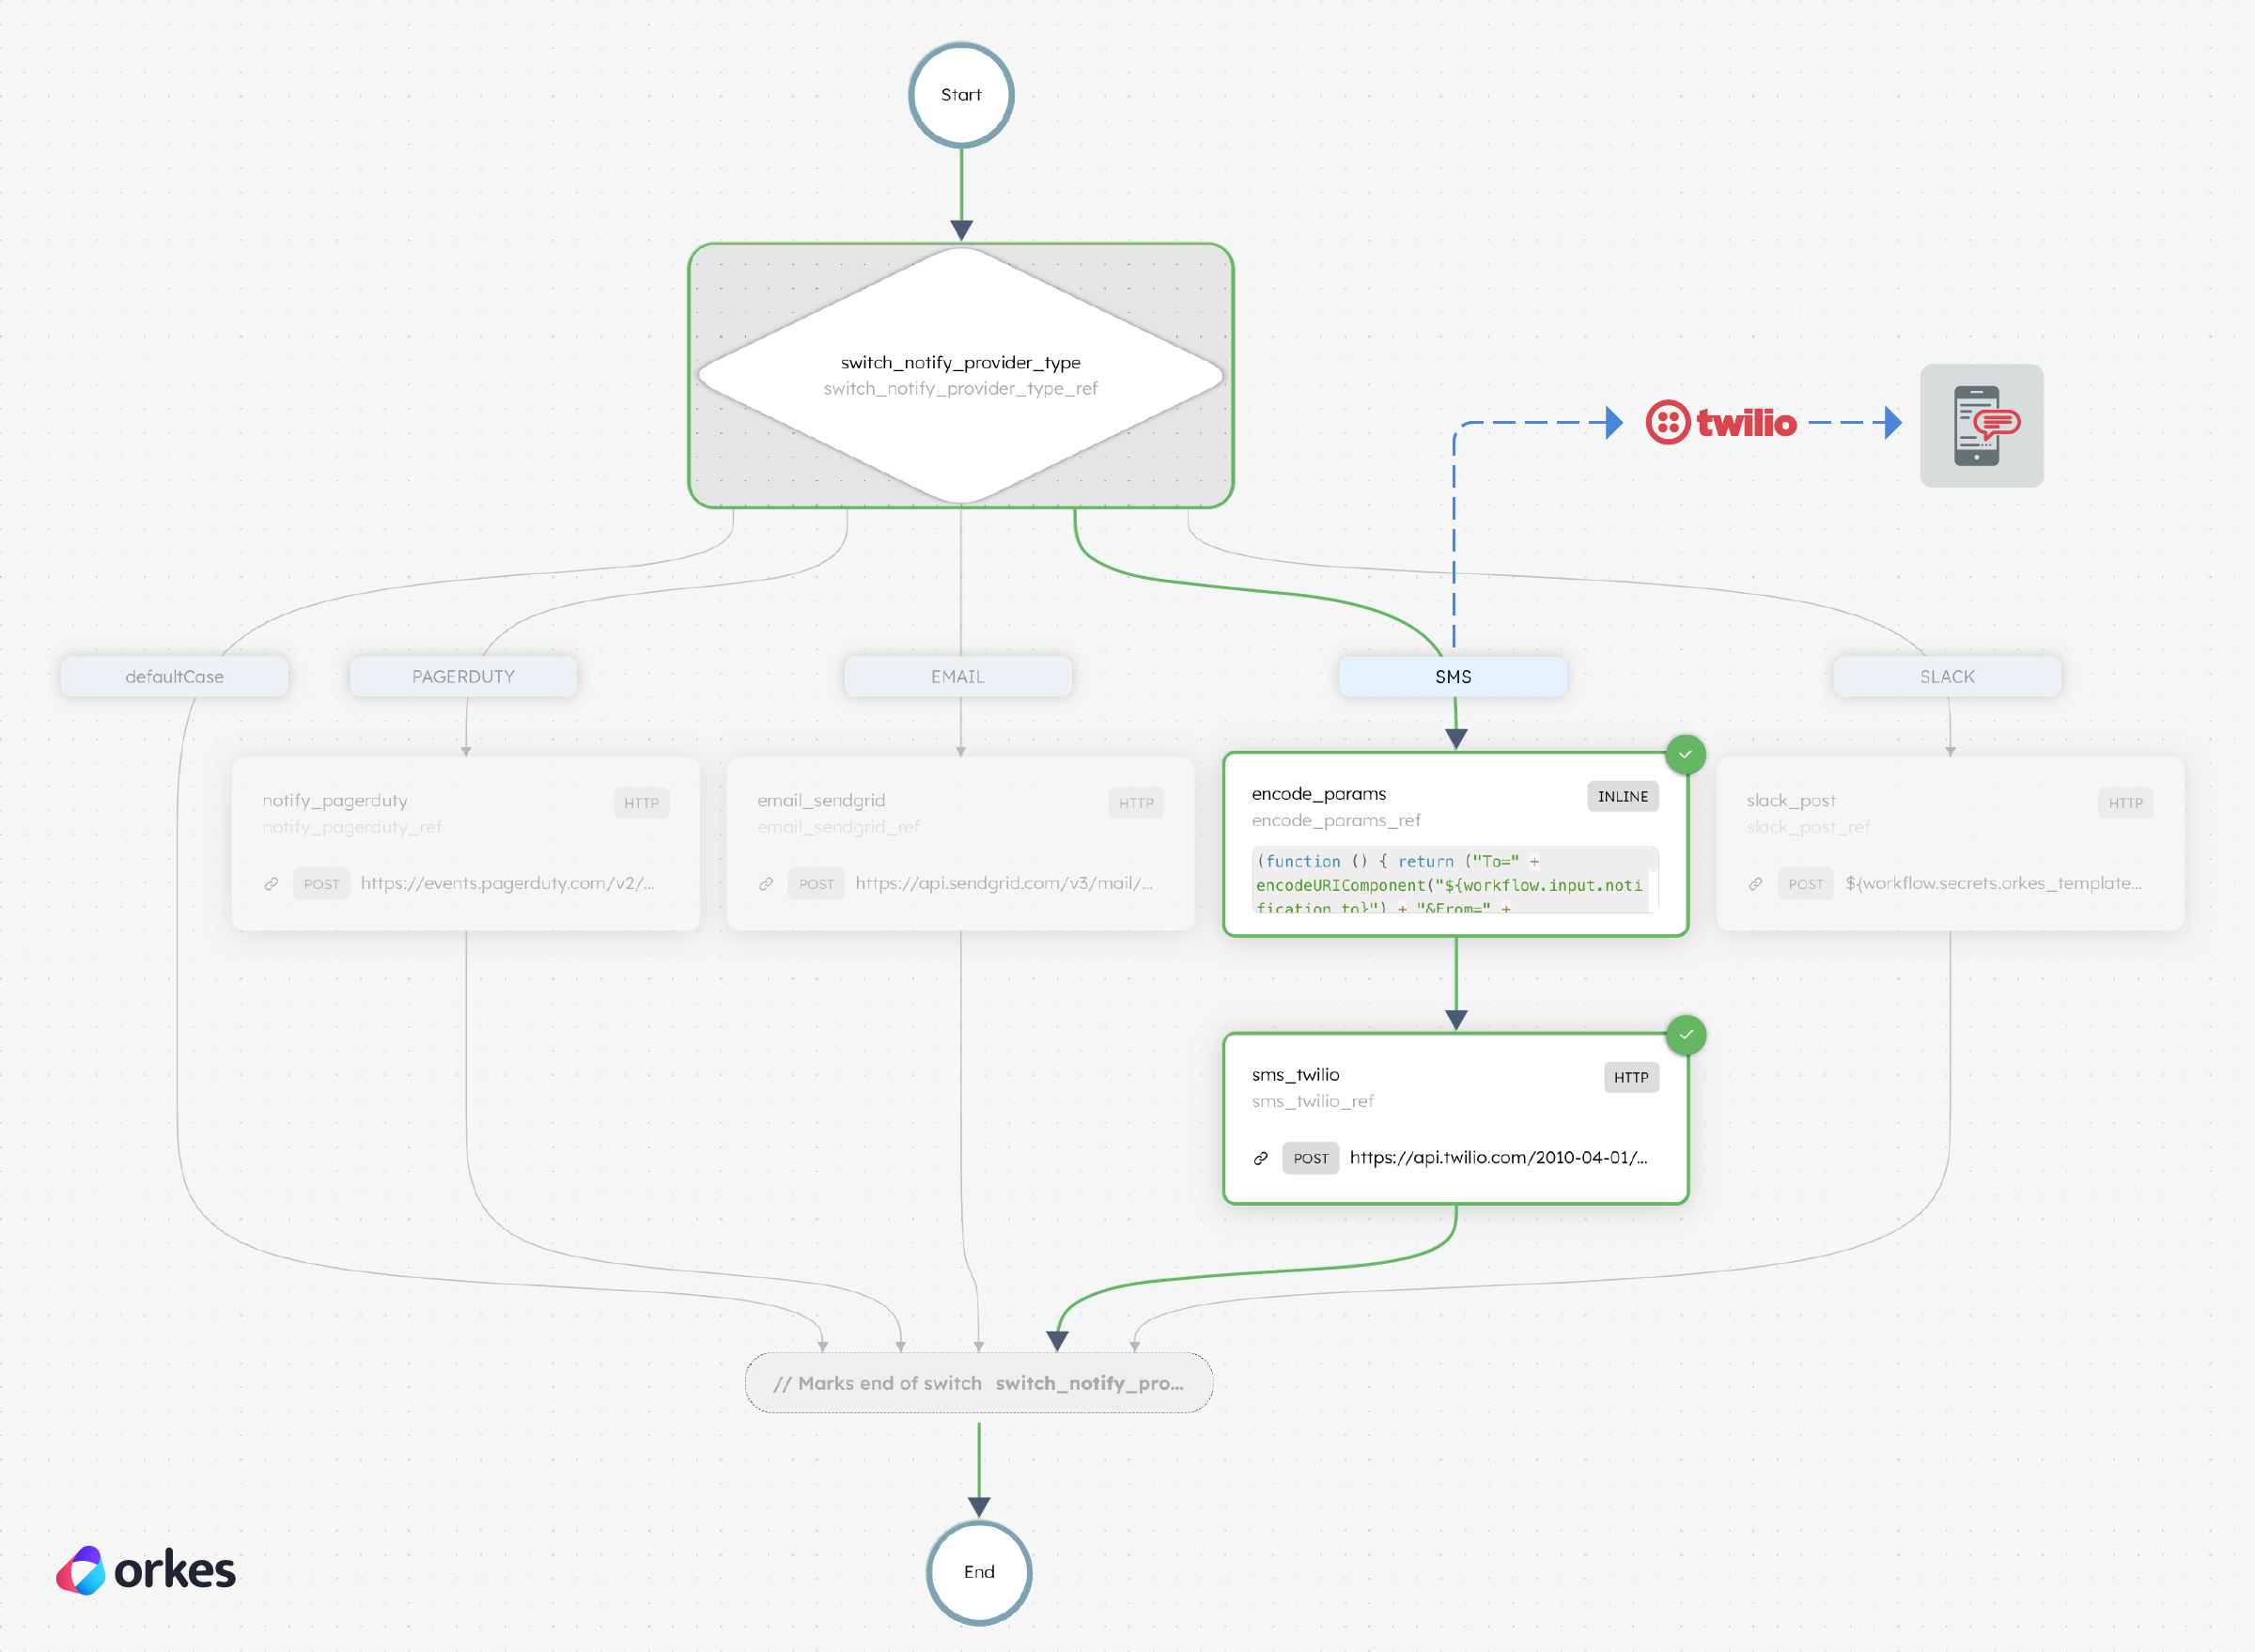
The workflow is set up to send notifications via SMS using Twilio, emails through SendGrid, Slack channel alerts, and PagerDuty notifications.
The notification method here is not restricted to just four channels. Adding more switch cases allows you to incorporate other notification systems to accommodate the organization’s preferences.
Here is the workflow definition for Notify-Channels workflow. To create the workflow, go to Definitions > Workflow in the Developer Edition.
Select + Define workflow and paste the code in the Code tab. Save the workflow. Your workflow looks like this:
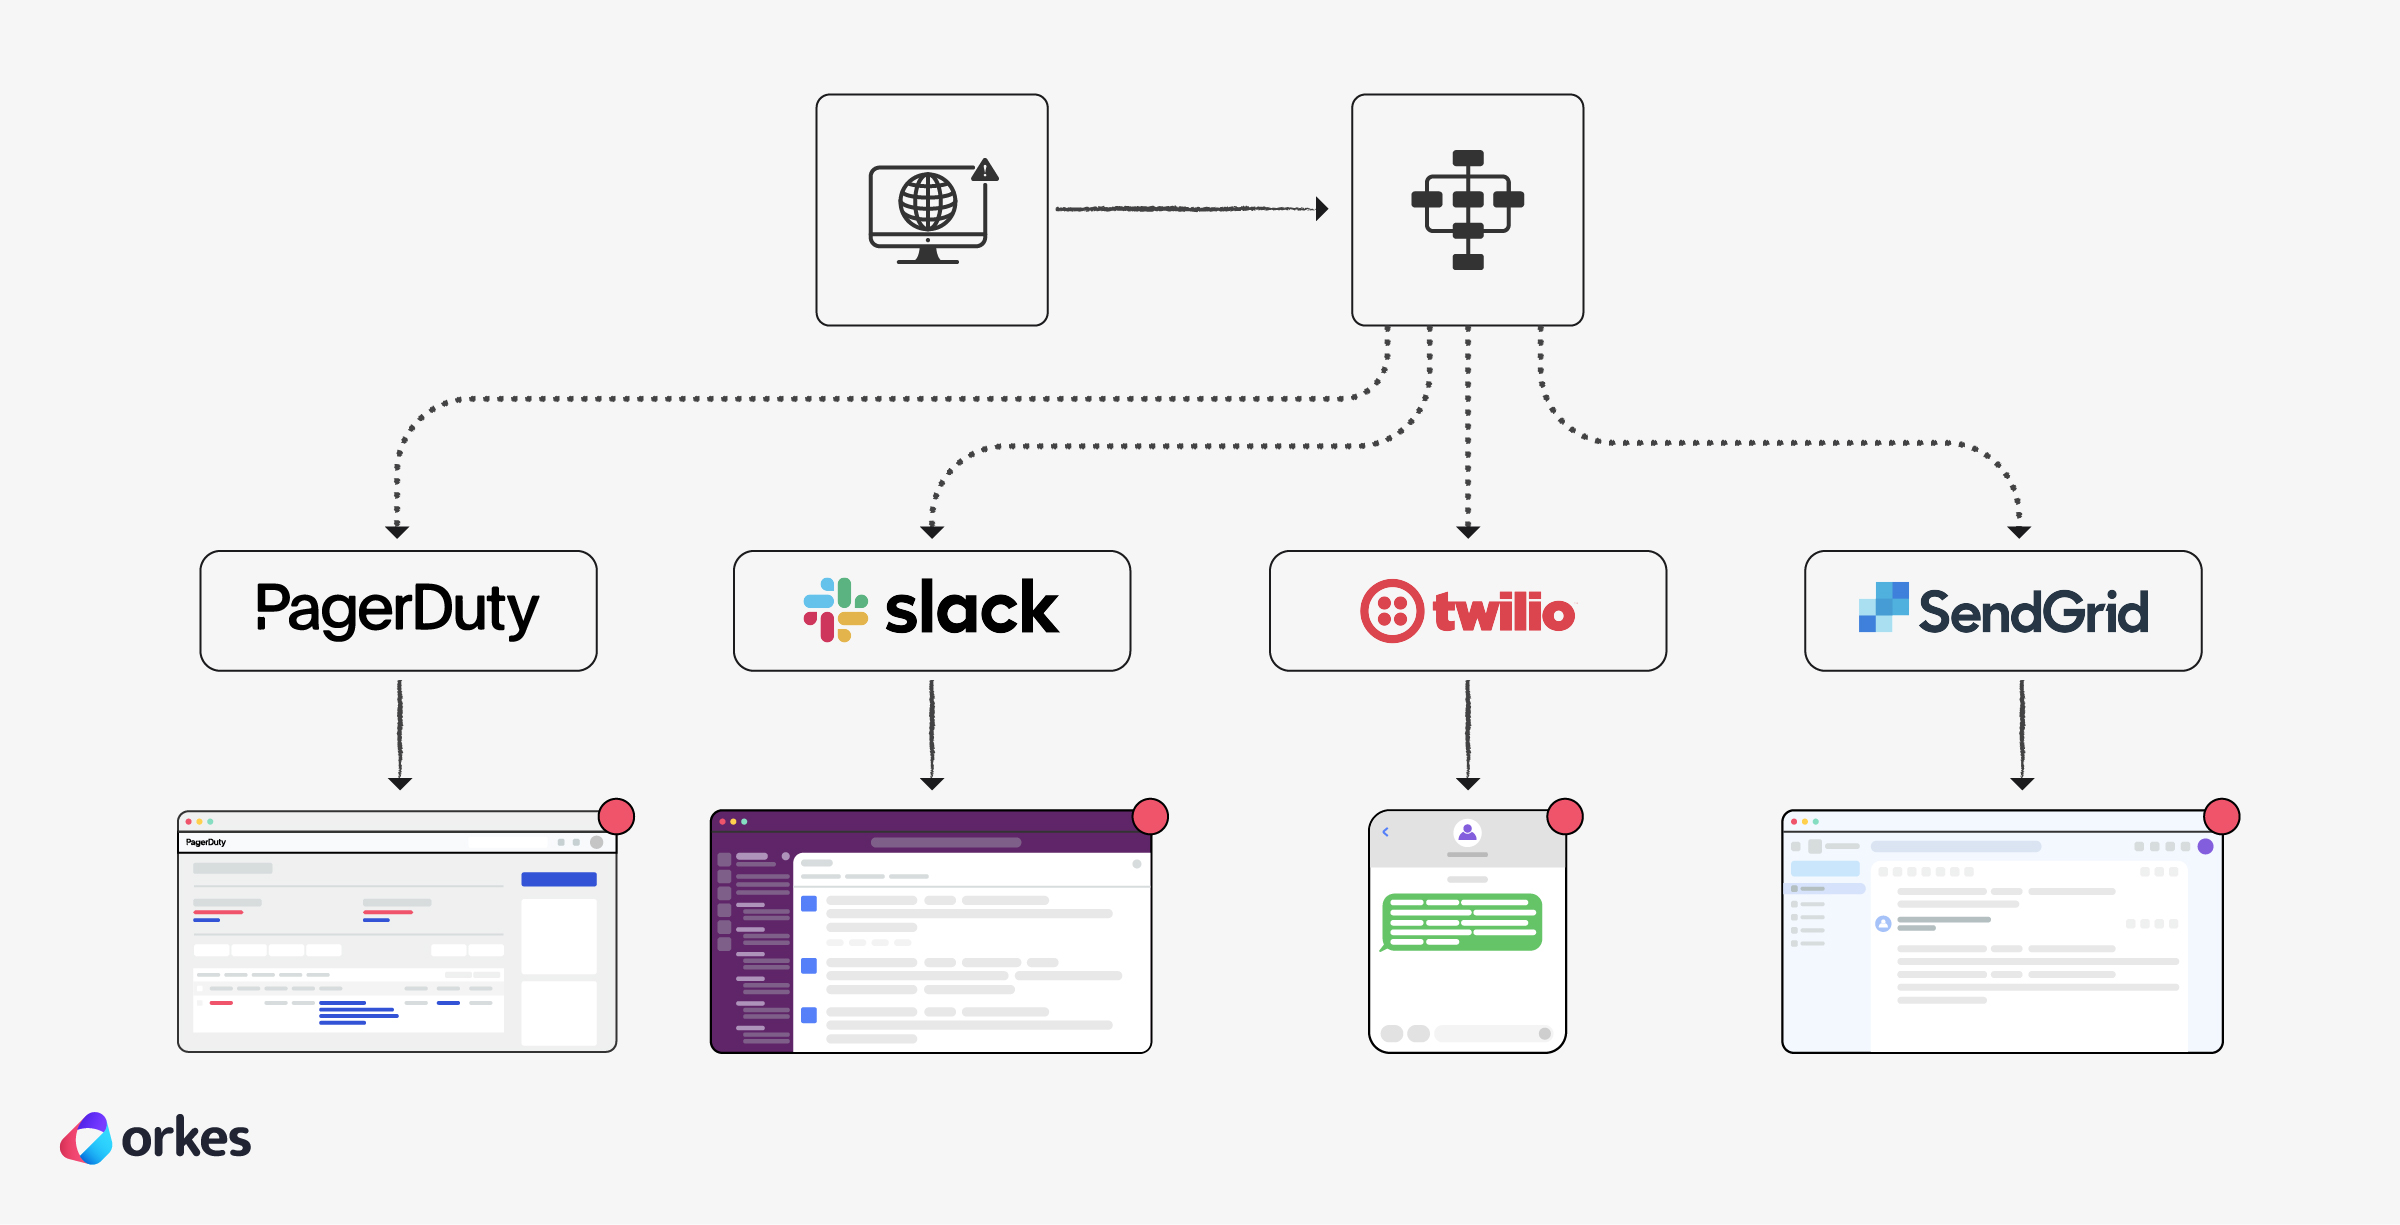
This workflow sends notifications using the following providers:
Configure your preferred provider and add the required credentials as secrets in Conductor.
| Notification Type | Provider | Credentials to be saved as Secret in Conductor |
|---|---|---|
| SMS | Twilio | The account ID of the Twilio account.
|
| Sendgrid | The API key from Sendgrid.
| |
| SLACK | Slack | Slack Webhook URL.
|
| PAGERDUTY | Pagerduty | Routing key for sending messages to Pagerduty.
|
The workflow is already configured with the above-mentioned secret names, so no further modifications are needed.
After setting up the required provider, run the workflow to monitor an endpoint using a sample workflow input:
{
  "notification_type": "<NOTIFICATION-TYPE>", Supports EMAIL,SMS, SLACK OR PAGERDUTY.
  "endpoint_url": "<YOUR-ENDPOINT-URL>",
  "notification_from": "14XXXXXXXXX", // for SMS or EMAIL only
  "notification_to": "12XXXXXXXX" // for SMS or EMAIL only
}
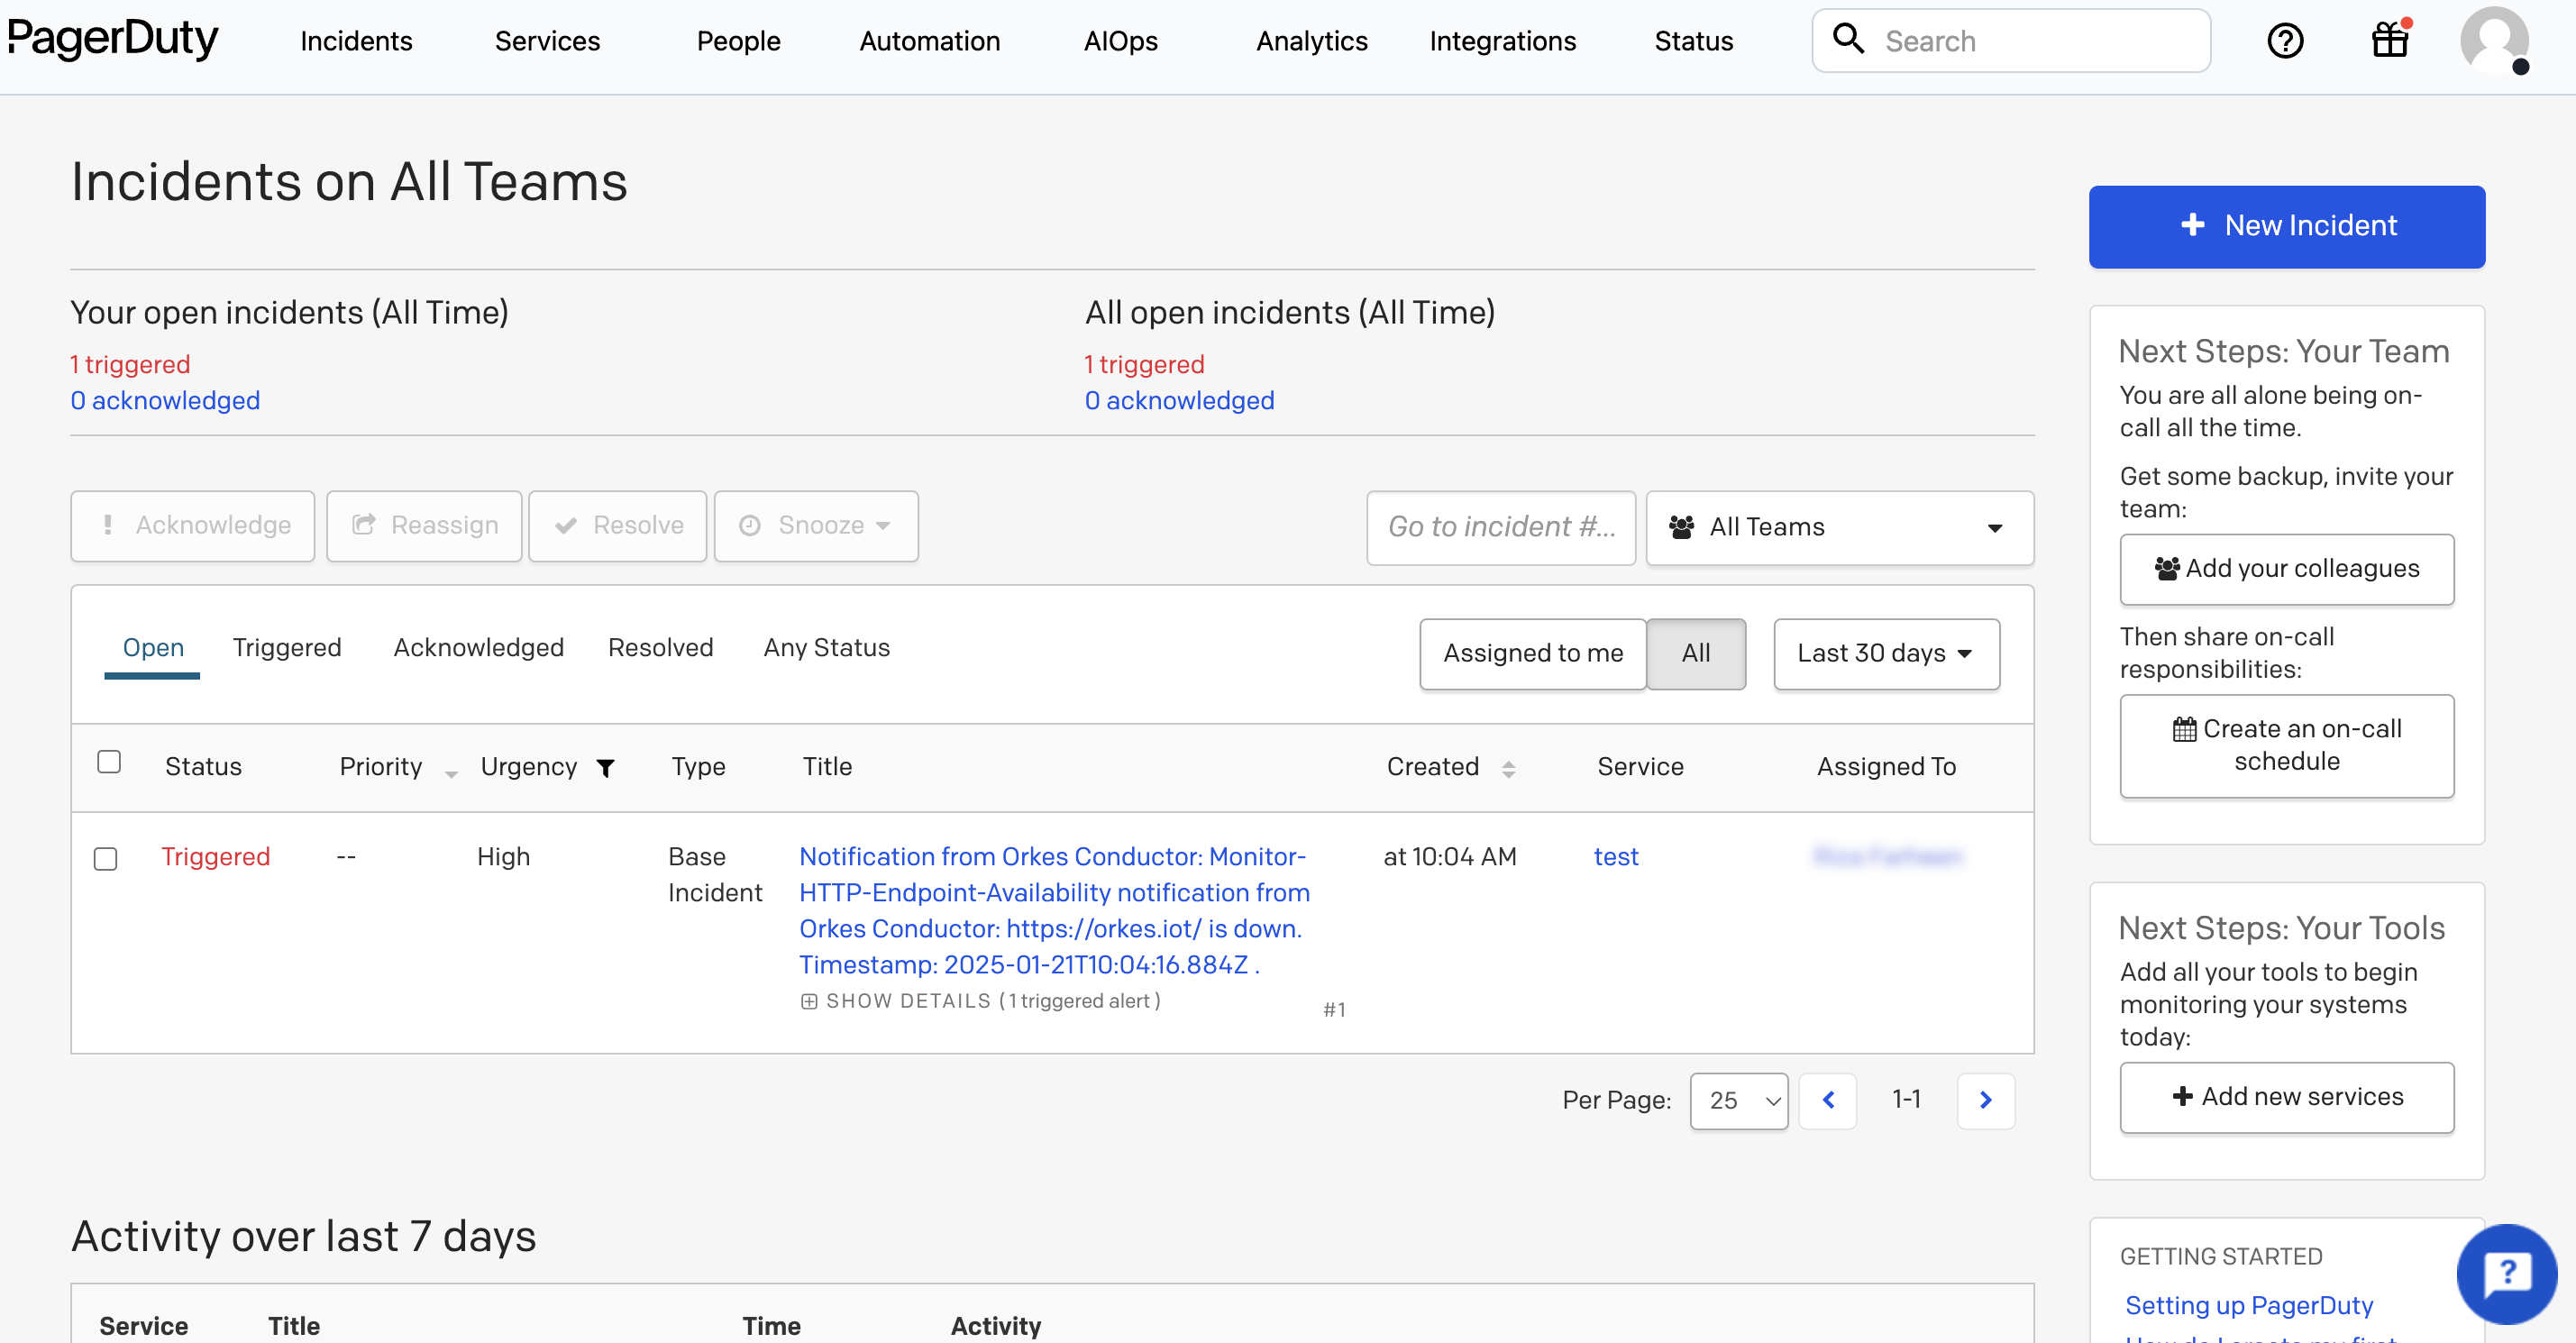
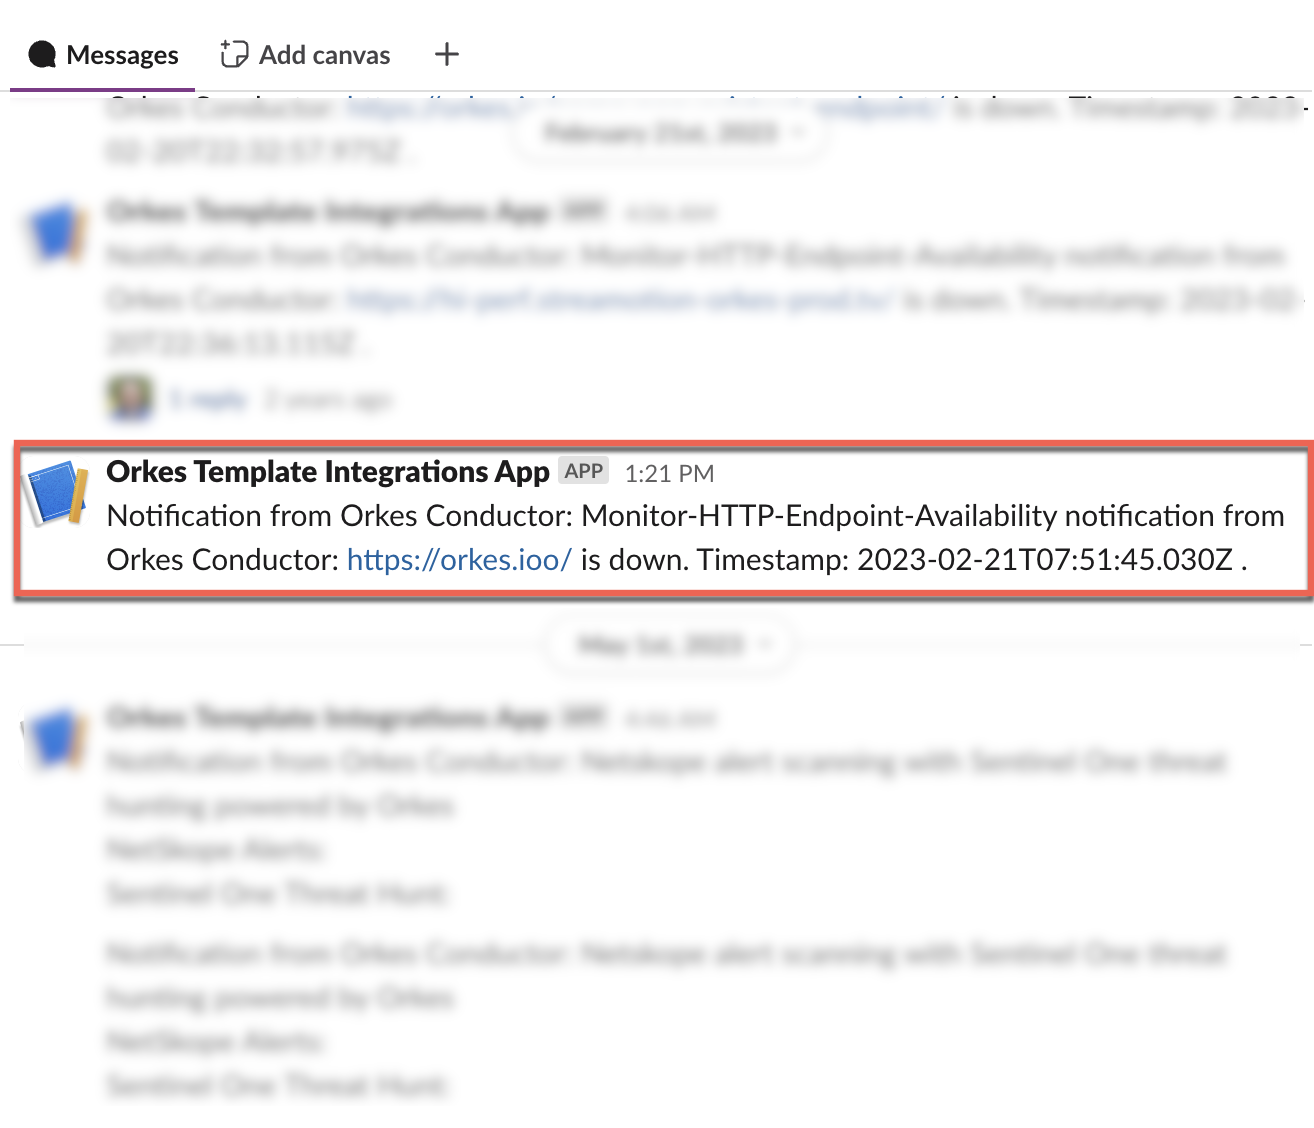
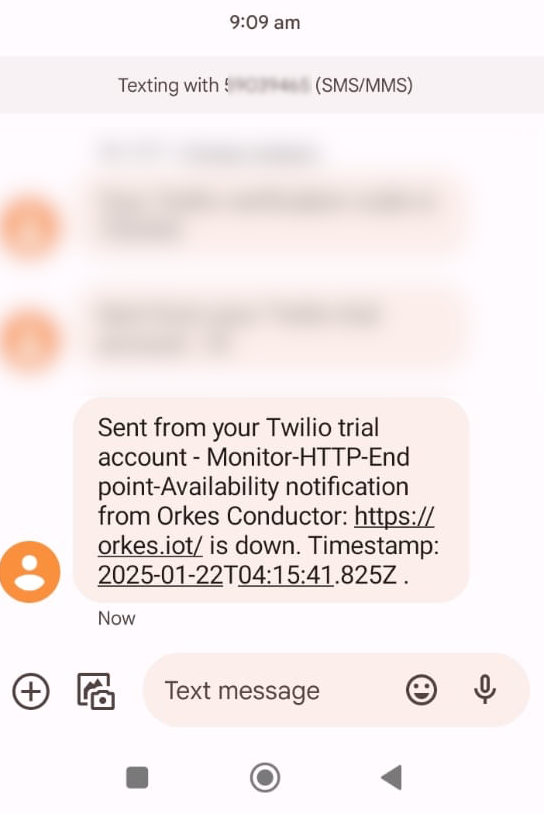
Example Output
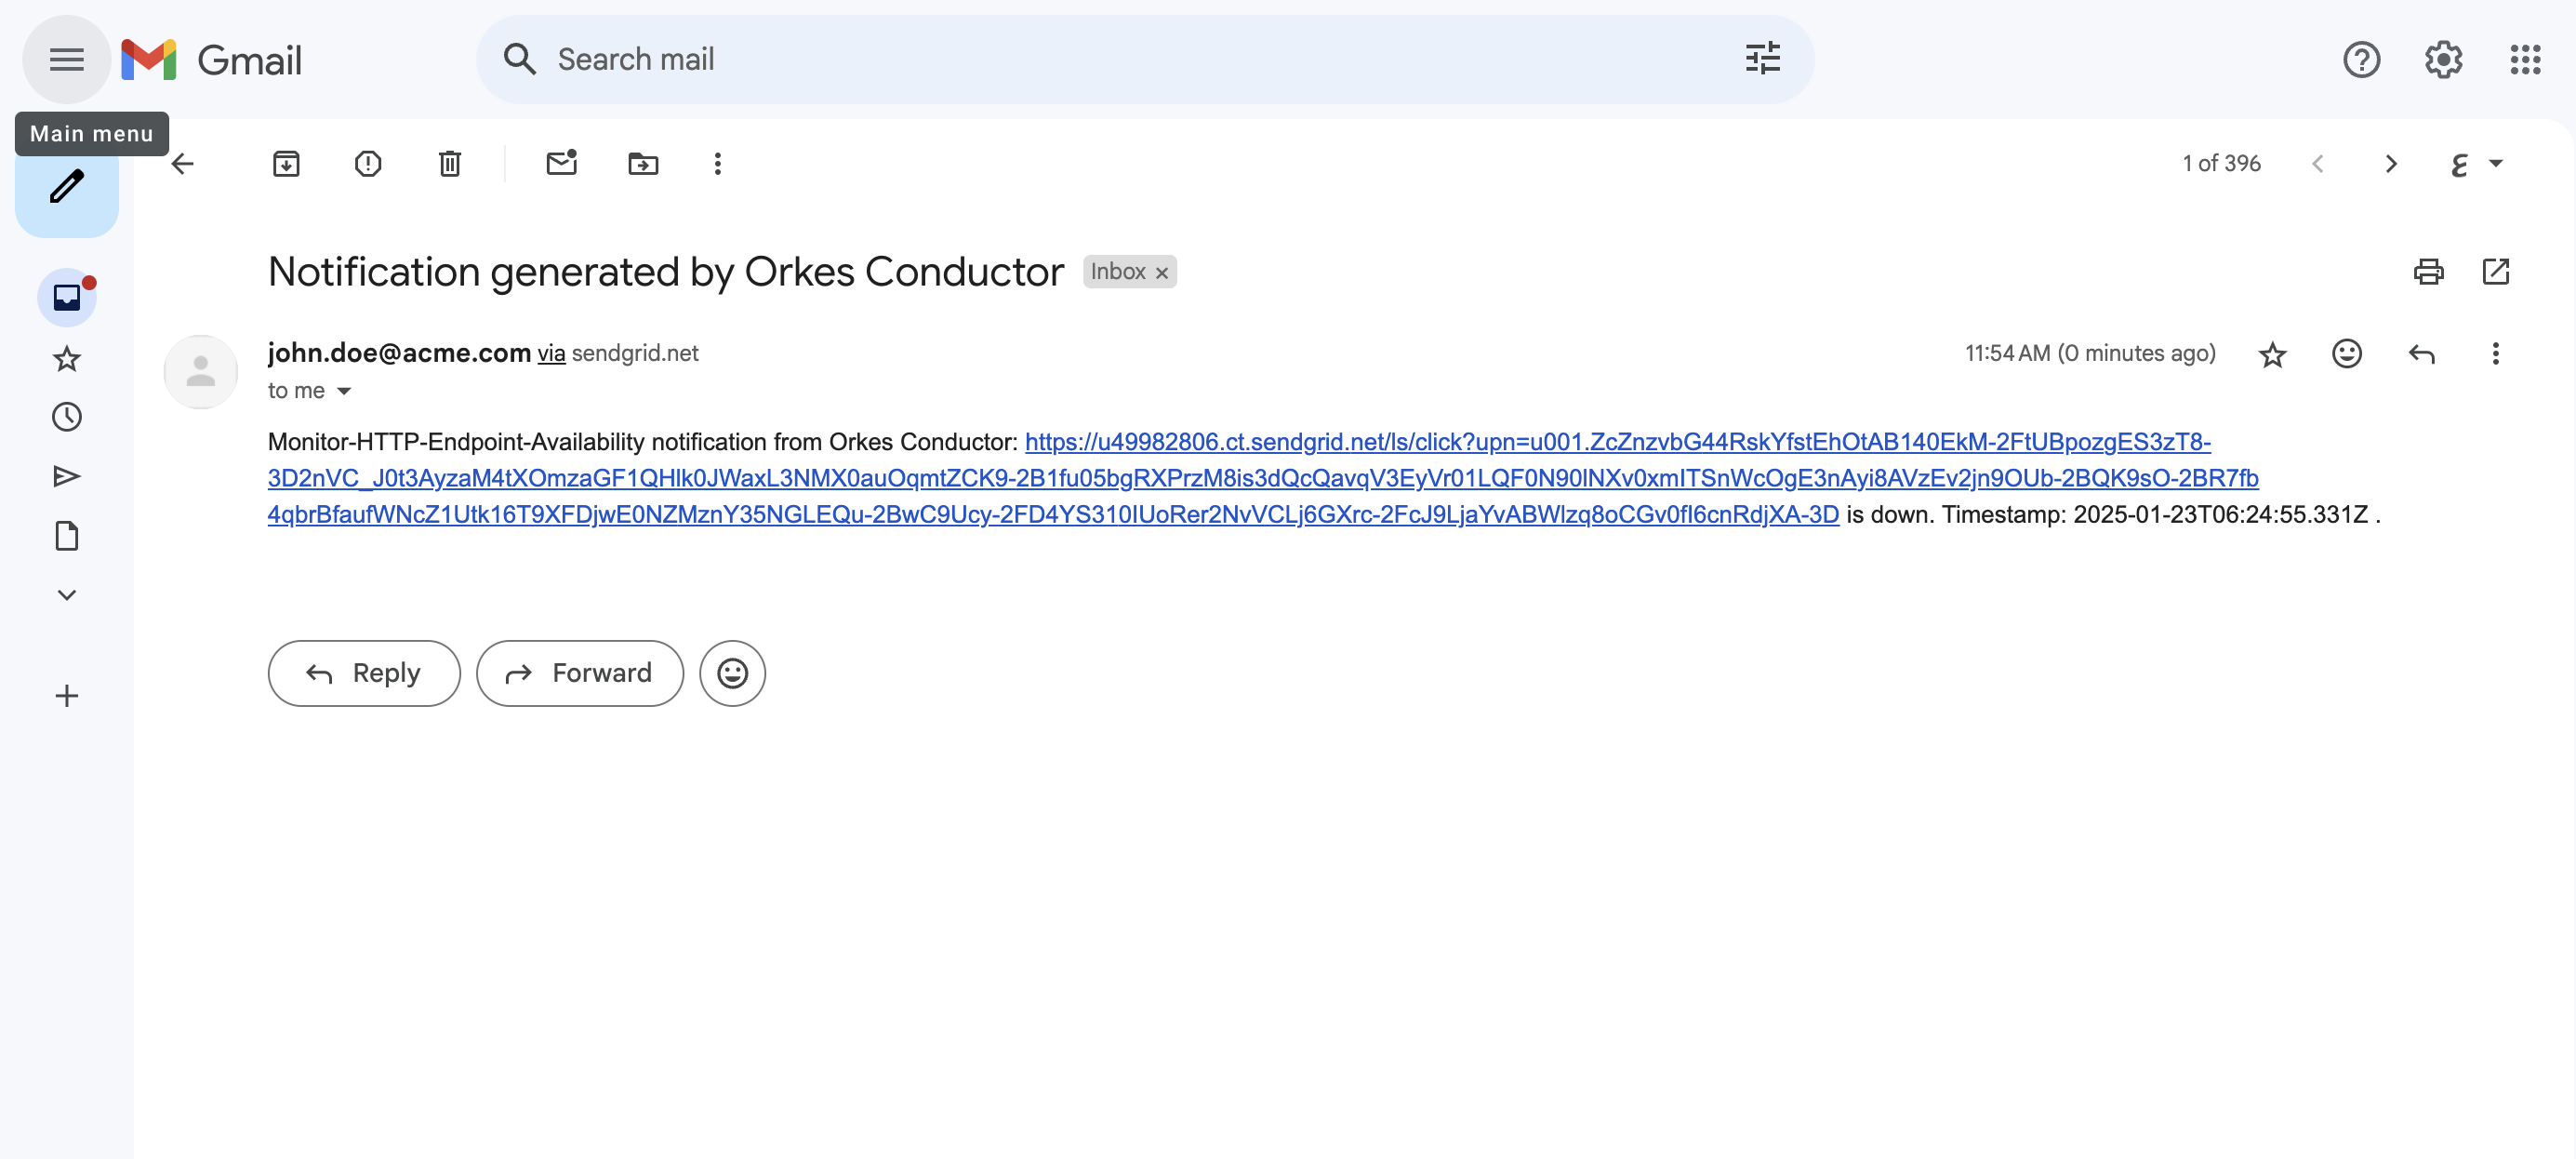
The final part is automating the monitoring process to check the endpoint availability every 2 minutes to achieve 99.999% uptime.
For this, create a Workflow Scheduler in Conductor, using cron expressions to set the workflow to run every 2 minutes. Once configured, Conductor will automatically trigger the workflow every 2 minutes without requiring any further action from the user.
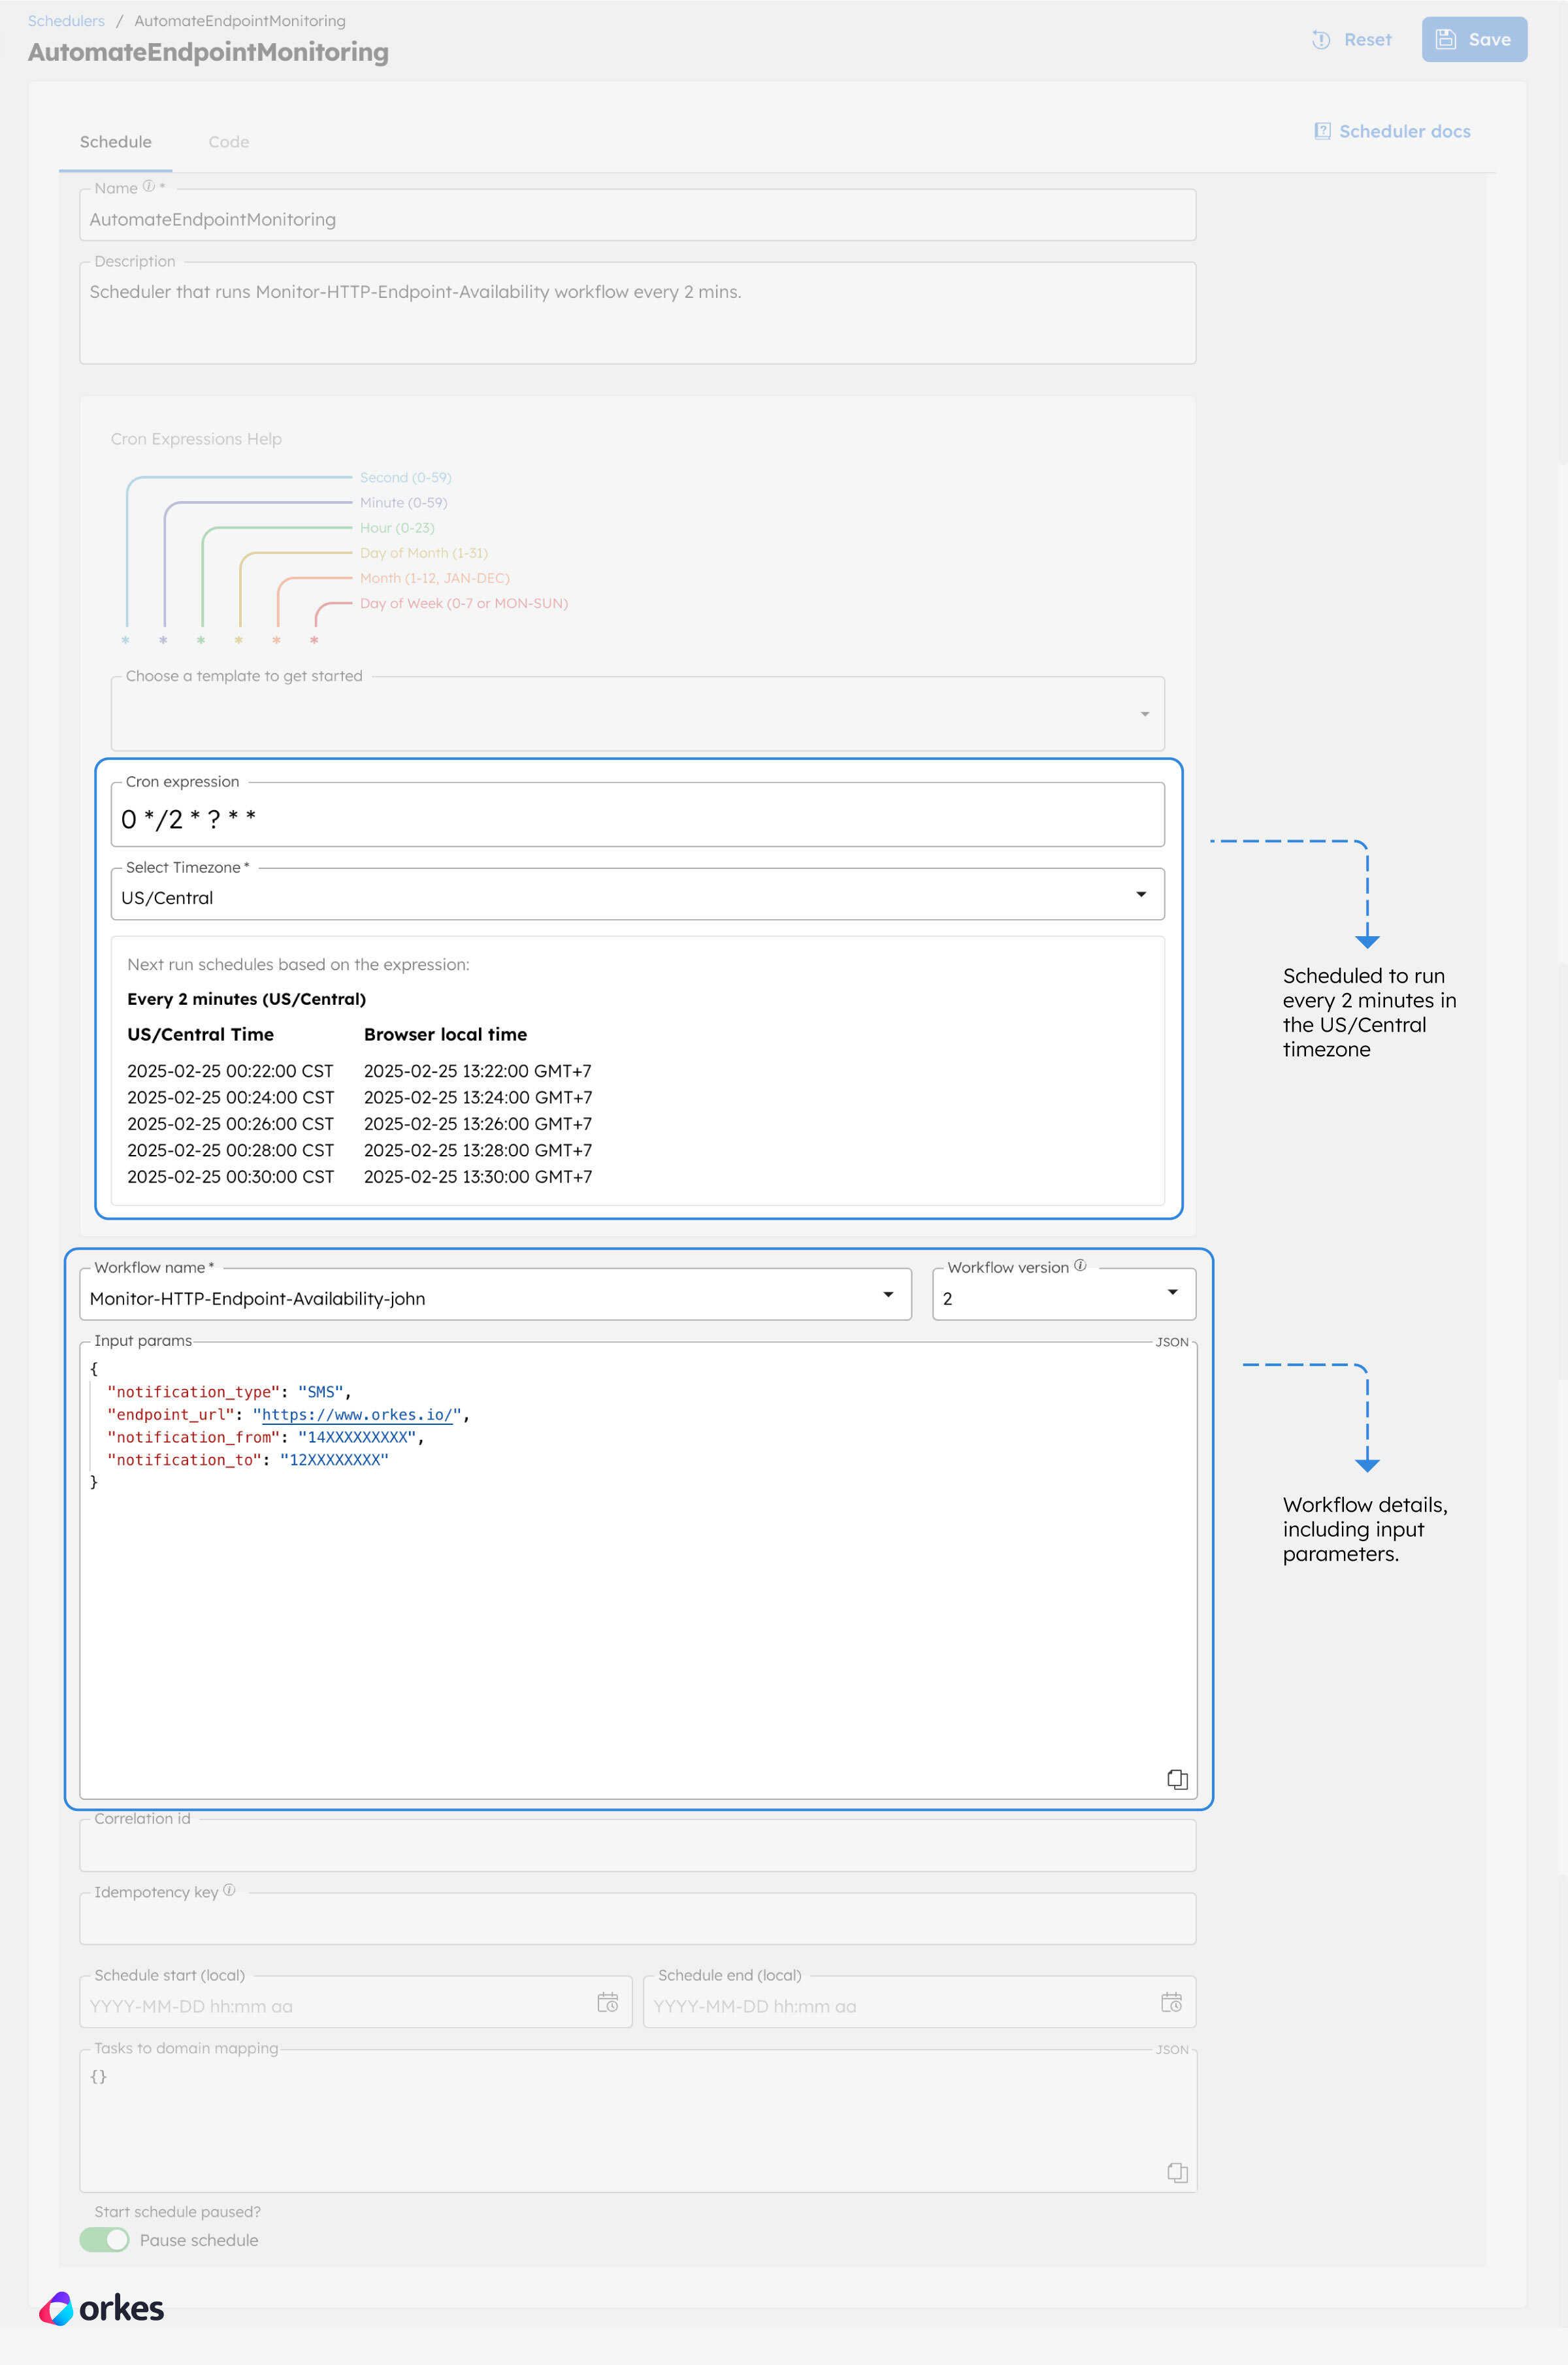
The ability to schedule workflows using cron expression greatly streamlines the automation of your workflows. Conductor further enhances this experience by supporting different time zones, avoiding the need for manual time conversions. Yet another outstanding feature of Scheduler is its user-friendly interface, which displays upcoming scheduled runs, allowing you to verify and confirm your schedules easily.
While this uptime monitoring system is a simple version, you can use Orkes Conductor to extend the flow further to suit your specific application needs.
Uptime monitoring of services is crucial for a business to thrive, as it directly impacts revenue. By leveraging tools like Orkes Conductor, you can build an automated monitoring system to track your services 24/7 to achieve 99.999% uptime. This, in turn, can decrease the customer churn rate and ultimately enhance customer satisfaction and loyalty.
–
Orkes Conductor is a powerful workflow orchestration platform that simplifies and automates all your application flows. Whether monitoring service uptime, creating AI-powered applications, or building a RAG system, Orkes Conductor offers the flexibility and scalability to meet your business needs. Try out Orkes Conductor for free using our Developer Edition sandbox.