Monitor Gateway Metrics
Orkes Conductor’s MCP/API Gateway provides built-in metrics at both service and route levels. These metrics help you monitor performance, and identify usage trends, allowing you to troubleshoot issues in real time.
You can view metrics by selecting the Metrics tab from any service or route.
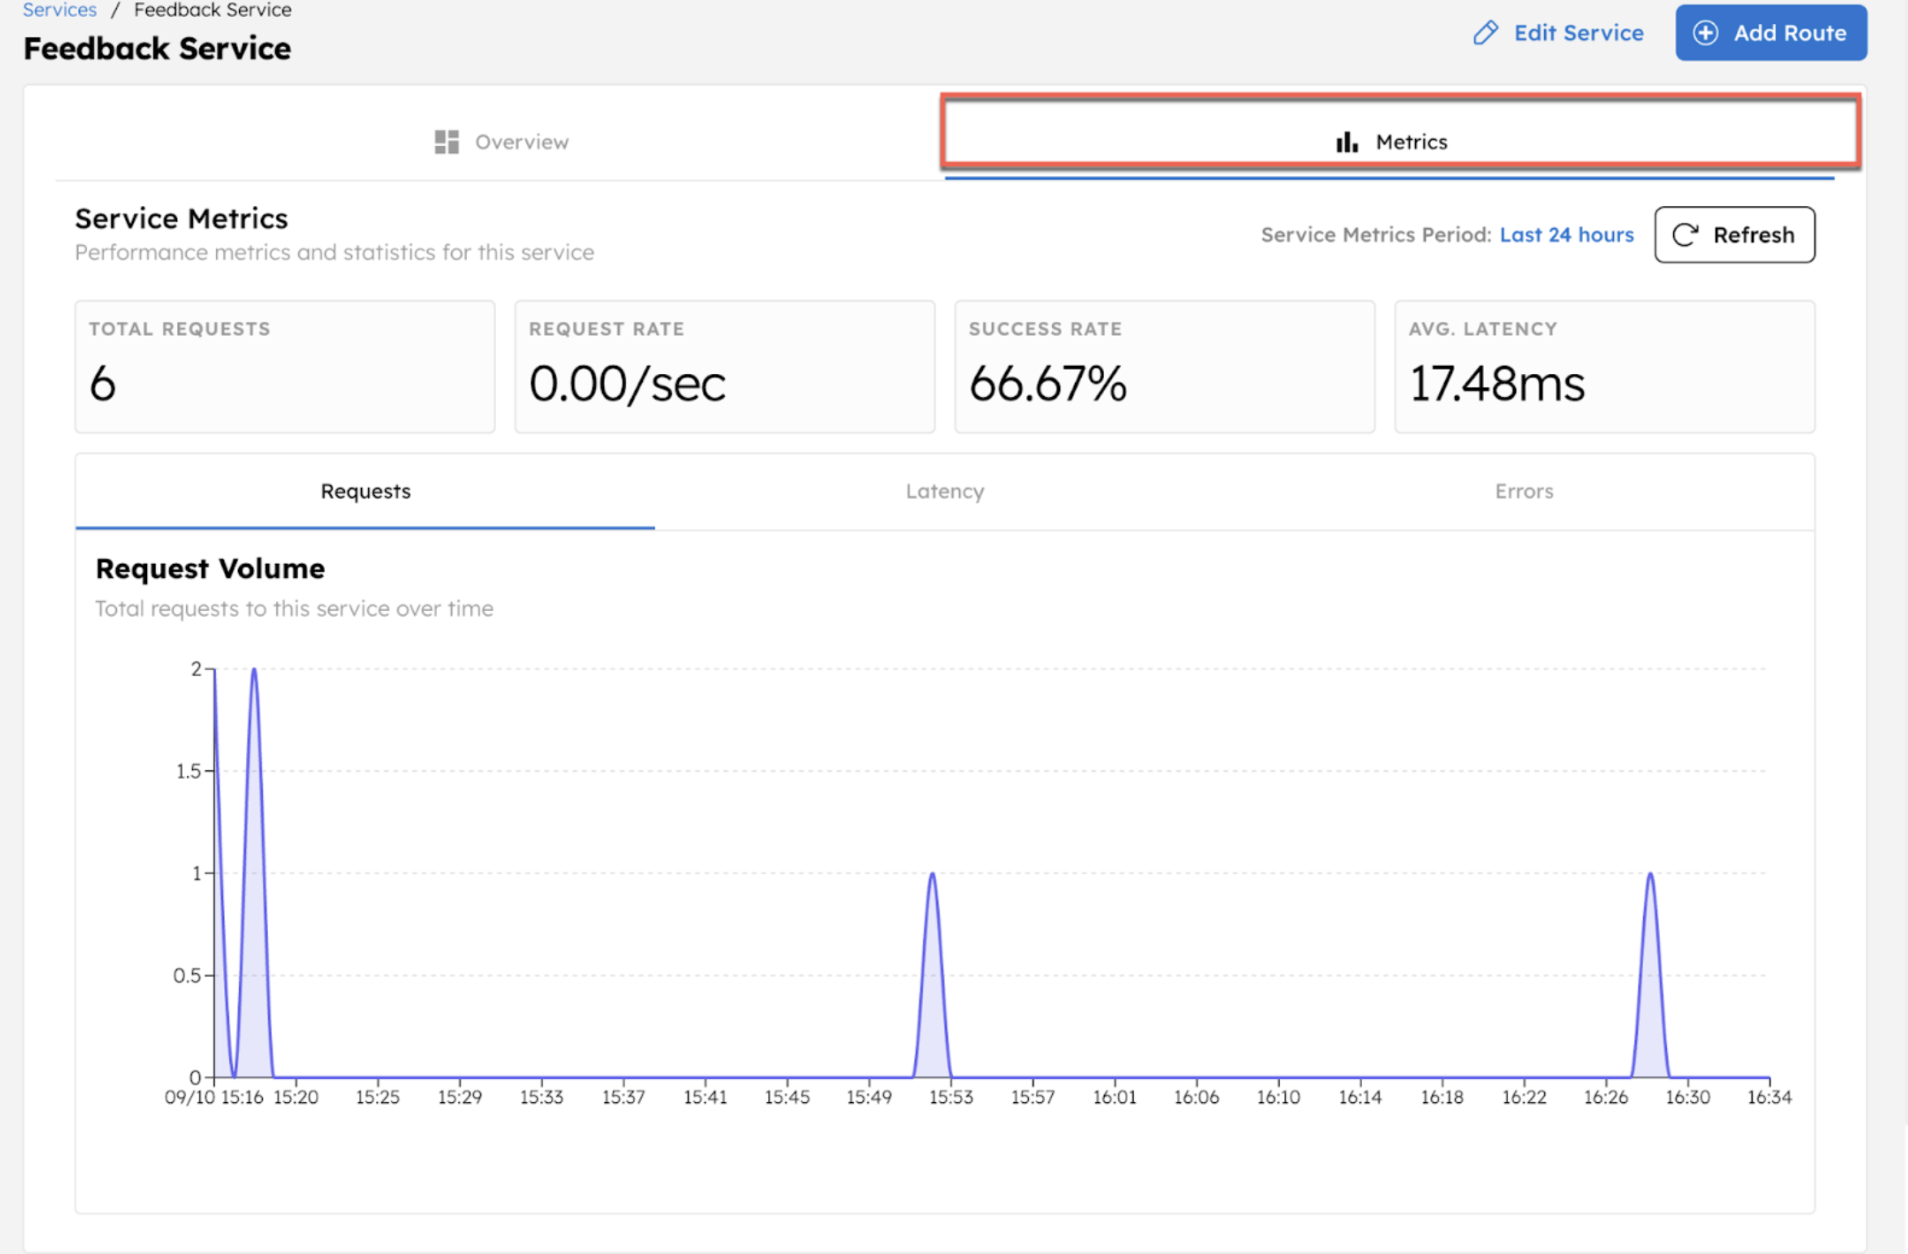
Performance metrics
| Metric | Description |
|---|---|
| Total Requests | Total number of requests made to the service or route. |
| Request Rate | Average number of requests per second. |
| Success Rate | Percentage of successful workflow executions triggered by the service or route. |
| Avg Latency | Average time (in milliseconds) taken to complete a request. |
Statistics
The Statistics view provides detailed insights into request volume, latency patterns, and error trends for each service or route. Use this section to analyze performance behavior over time and identify issues that may need attention.
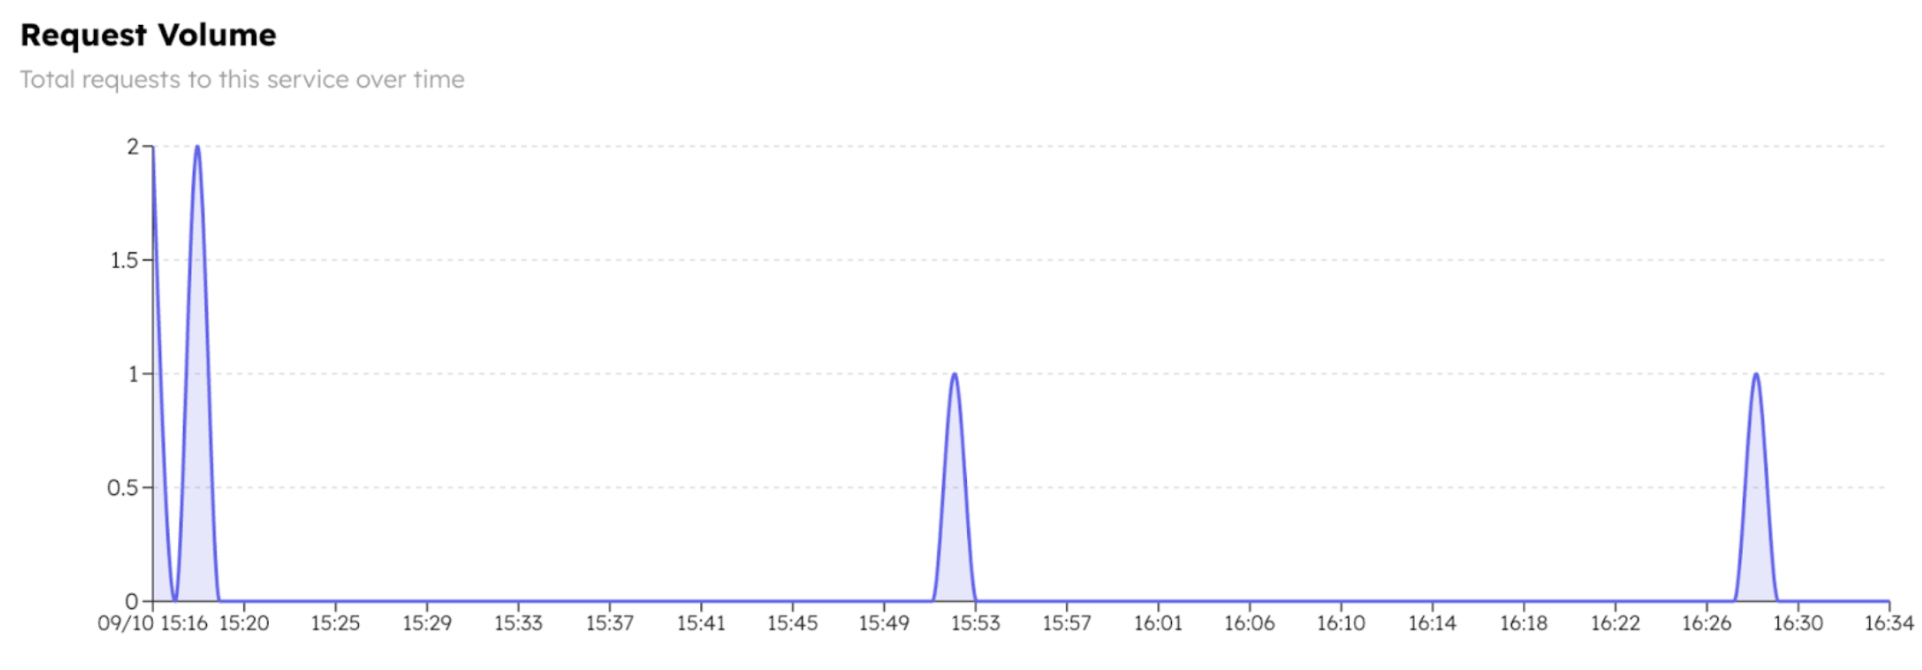
Requests
The Requests tab includes a line graph showing request volume over time. Use this view to monitor usage patterns, performance degradation, or abnormal error spikes across all routes in the service.
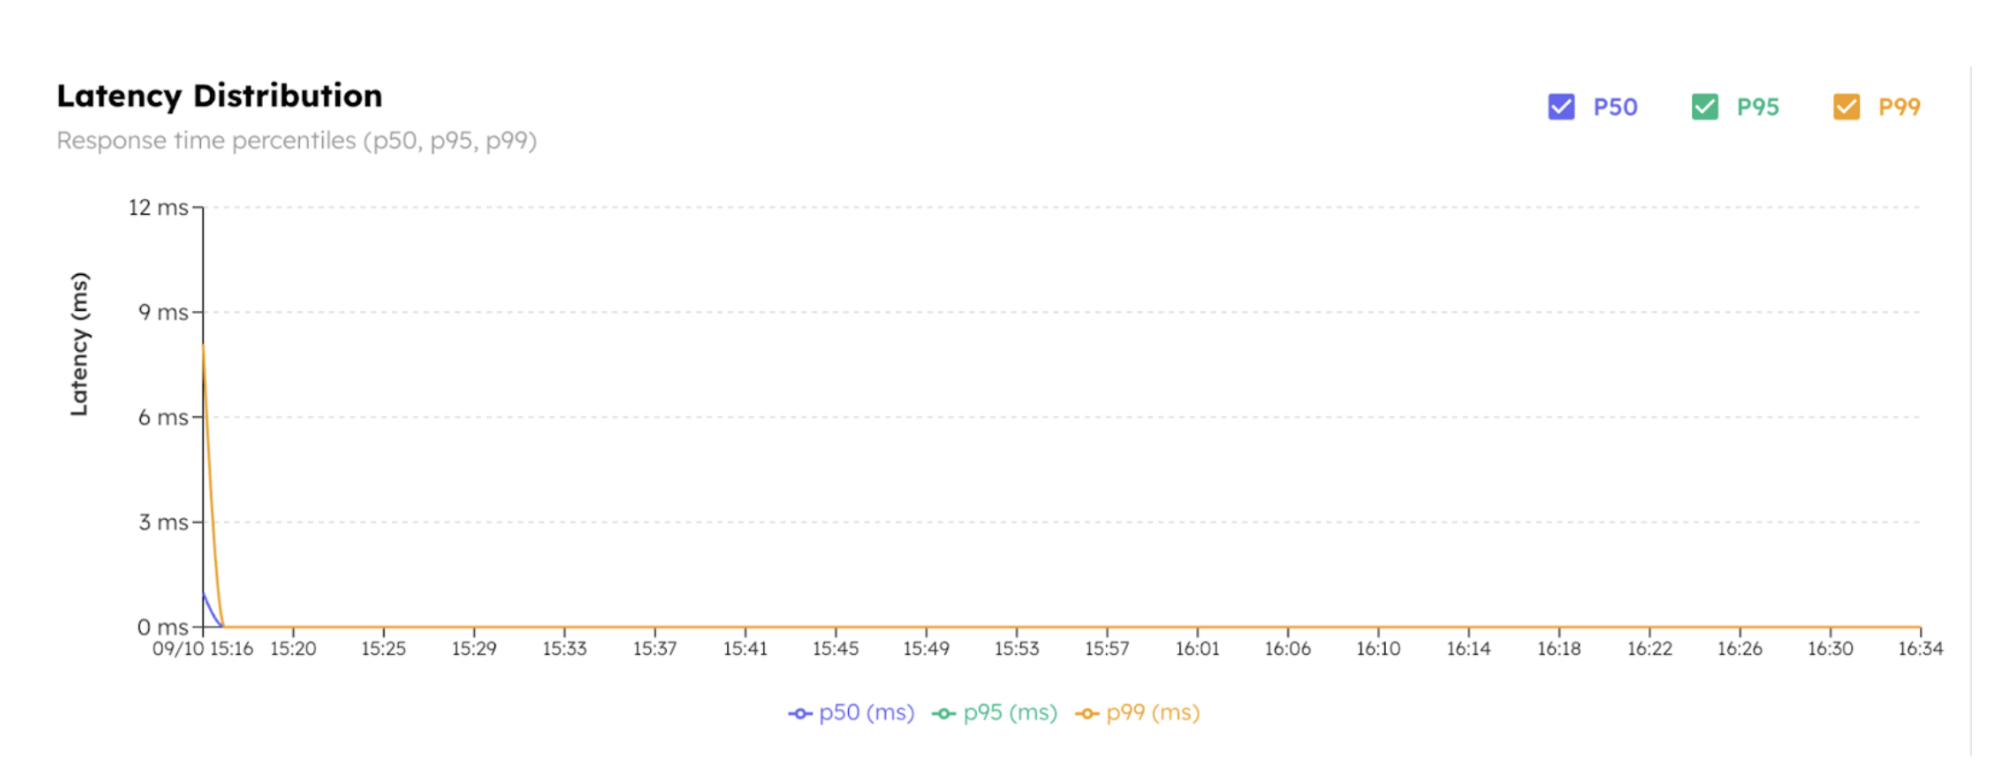
Latency
The Latency tab shows percentile-based response time distribution. Use this view to identify spikes or inconsistencies in performance.
- P50 (median): Half the requests responded faster than this latency.
- P95: 95% of requests completed faster than this latency.
- P99: 99% of the requests are faster than this latency.
Errors
The Errors tab visualizes failure trends and error types.
- Error Rate: Percentage of failed requests over time.
- Error Breakdown: Types of errors returned (e.g., 400 Bad Request, 500 Internal Server Error) and their frequency.
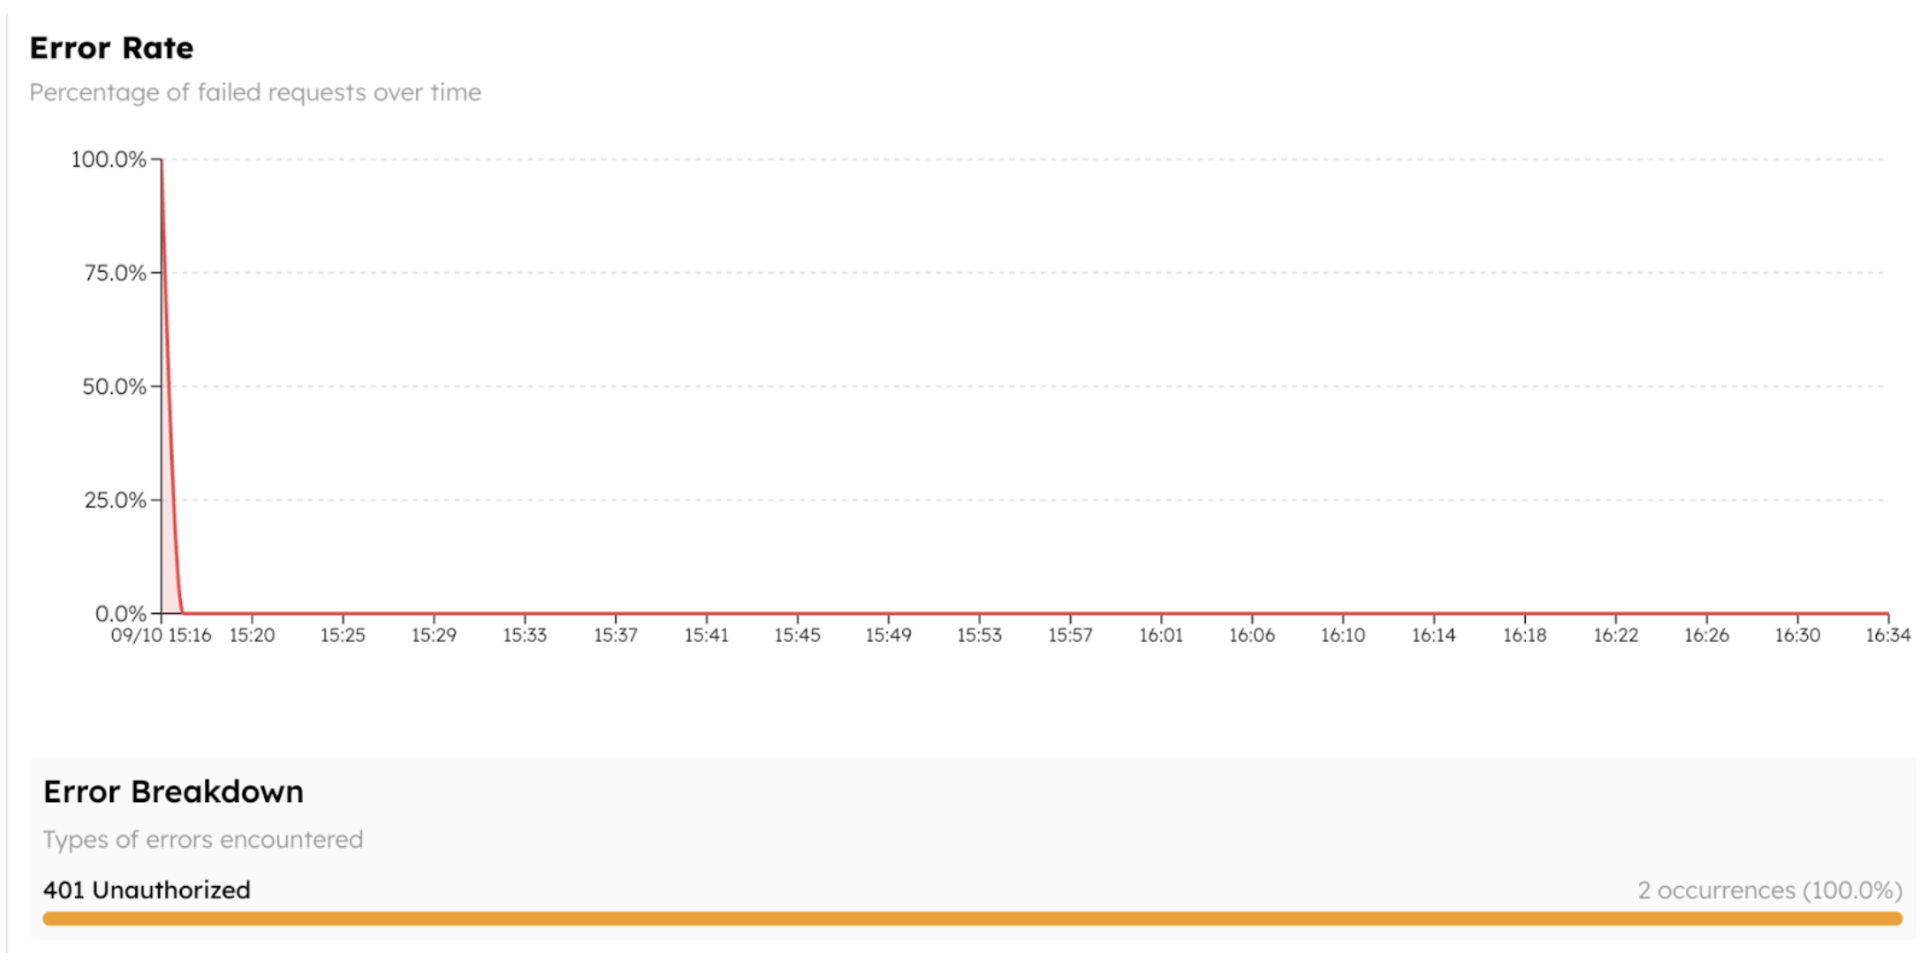
Hover over the graph to inspect error events by timestamp. Use this to correlate API failures with recent deployments or configuration changes.