Debugging Workflow Executions
Using Orkes Conductor’s visual workflow diagrams, you can quickly inspect and debug workflow executions during development. All viewable workflow executions are listed in Executions > Workflow.
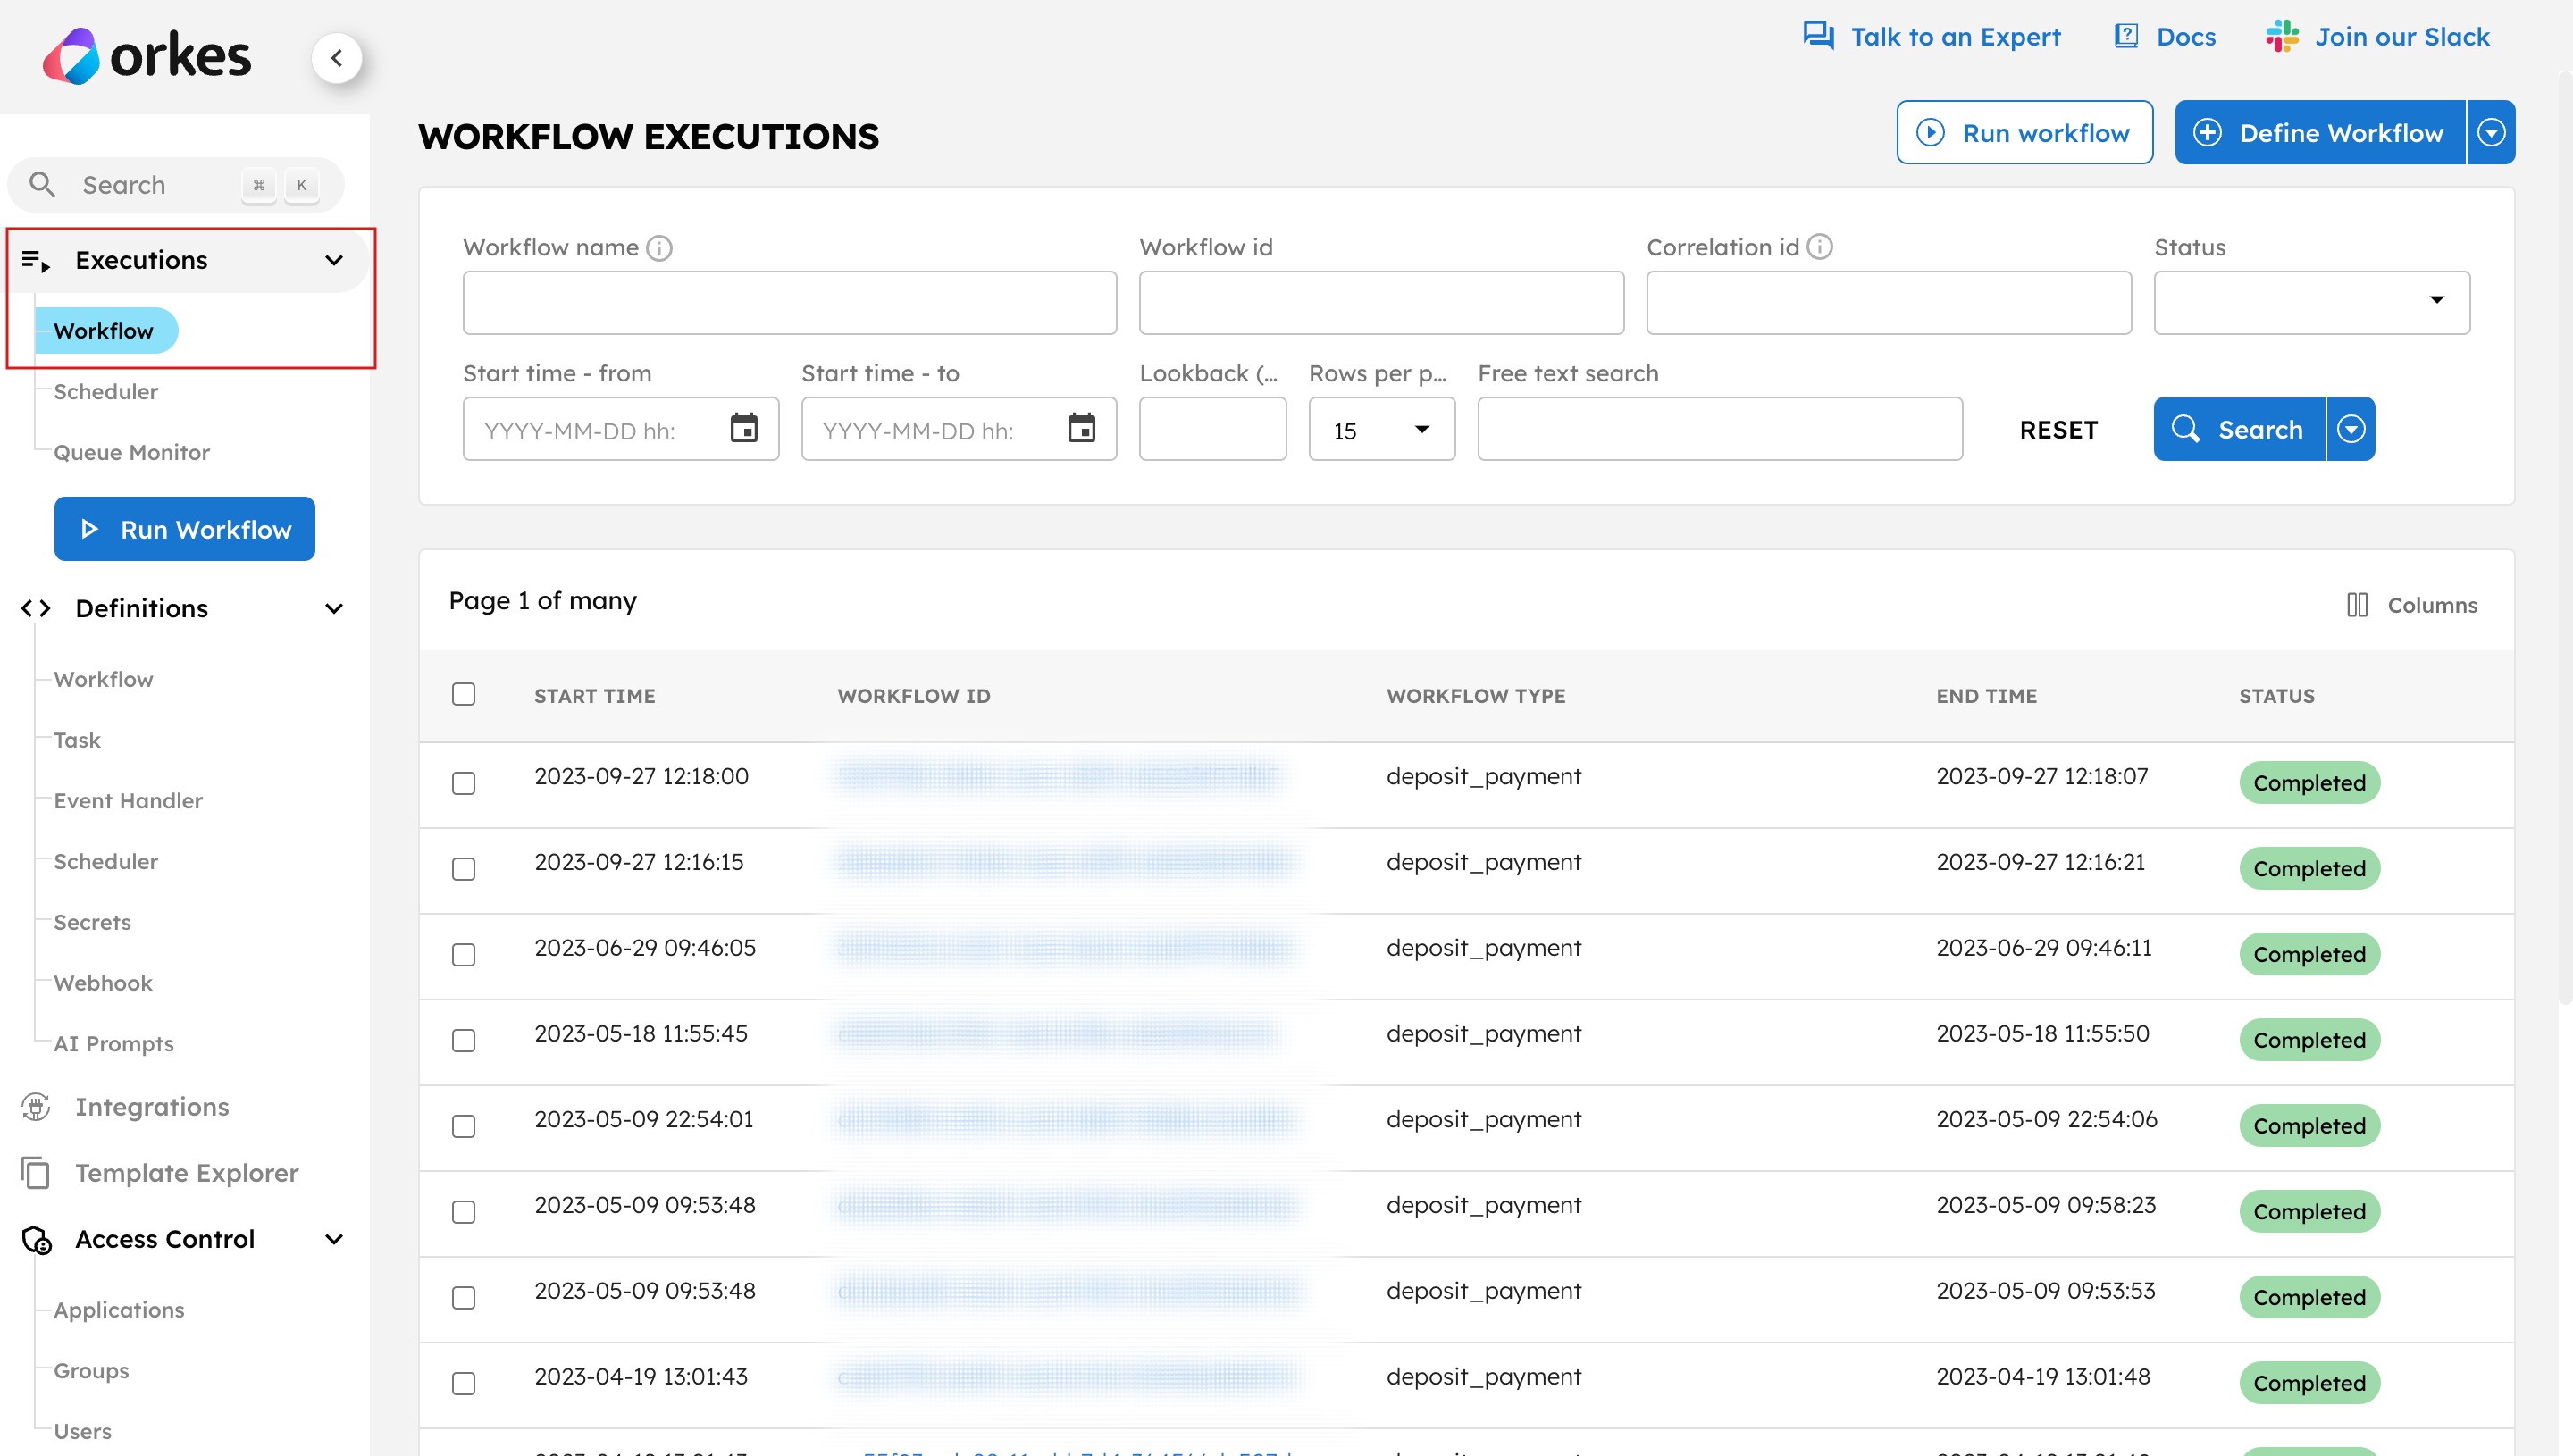
From this introspection dashboard, you can troubleshoot terminal errors and failures during execution.
Refer to Handling Failures for information on native failure-handling features that automatically resolve transient failures.
Searching workflow executions
The workflow execution data can be filtered by the following parameters:
- Workflow name
- Workflow ID
- Correlation ID
- Idempotency key
- Status
- Execution start time range
The free text search box also enables you to search inside workflow input values, workflow output values, workflow variable values, task output values, correlation ID, and reason for incompletion.
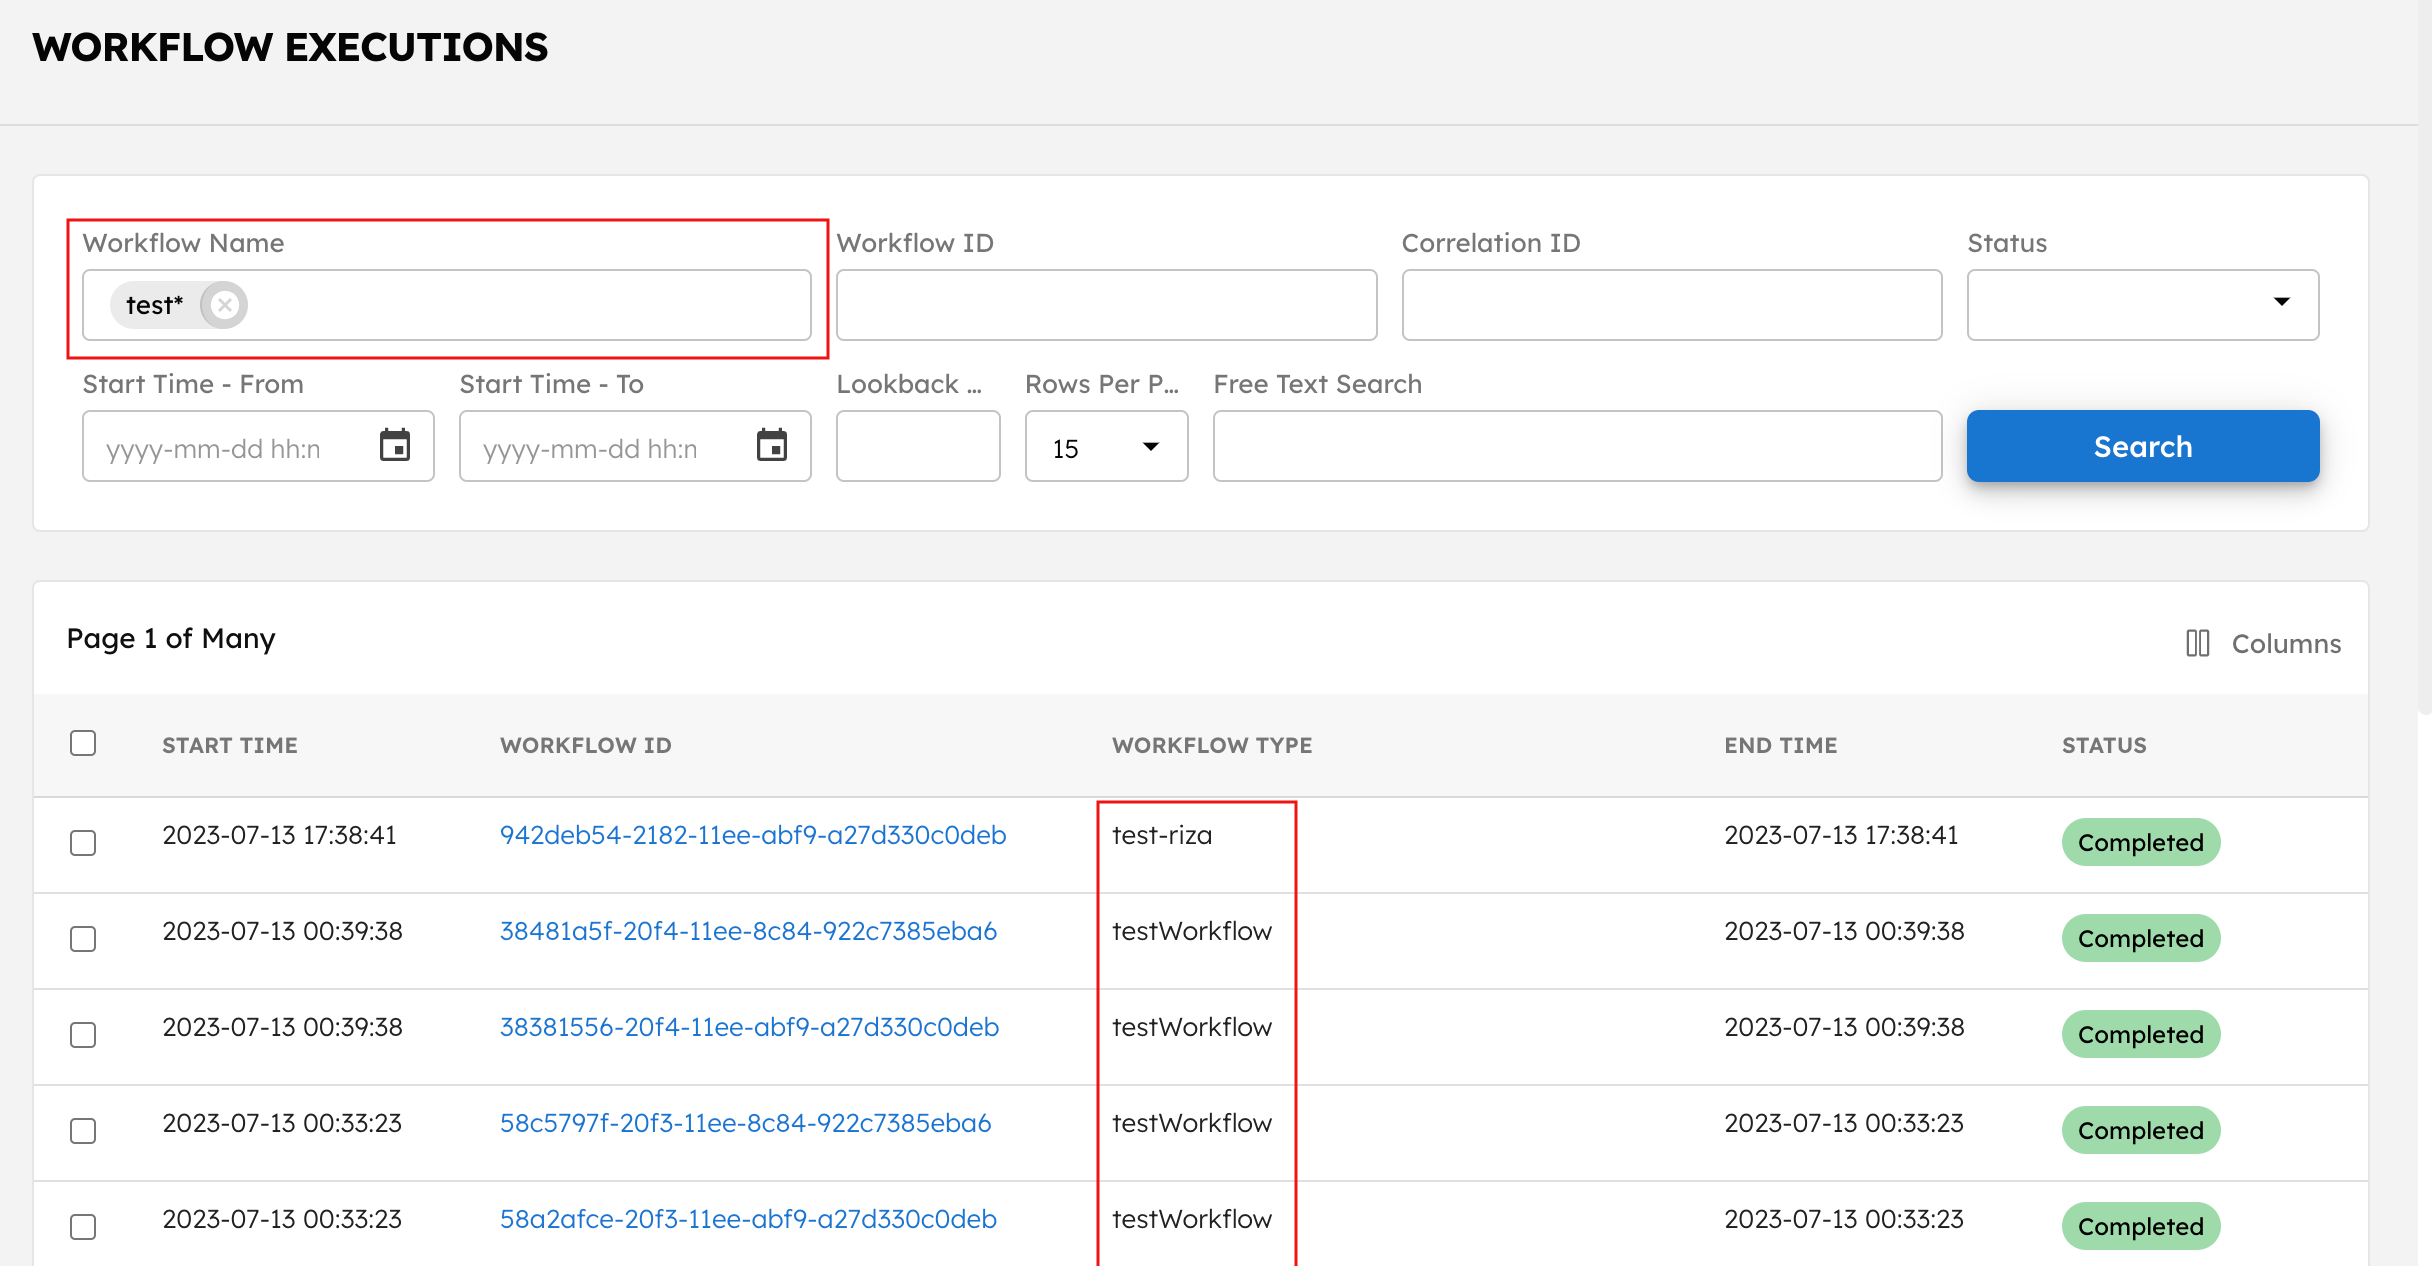
Partial search
Use the * wildcard to conduct partial searches for Workflow name or Free text search. For example, searching test* will display all workflows with names starting "test".
SQL search
You can switch on SQL format to search the workflow execution data in SQL format. The following syntax is supported:
FIELD = VALUEFIELD IN (value1, value2)AND
You can use SQL to search the following:
- workflowId
- correlationId
- workflowType
- status
- startTime
- modifiedTime
Example
Here are some example queries:
- workflowType = your_workflow_name
- status IN (PAUSED, RUNNING)
- startTime >1726655978410
- startTime < 1696143600000
- workflowType = your_workflow_name AND status = PAUSED
- workflowId IN (3434546, 45365767, 20984885) AND workflowType = test_workflow
API search
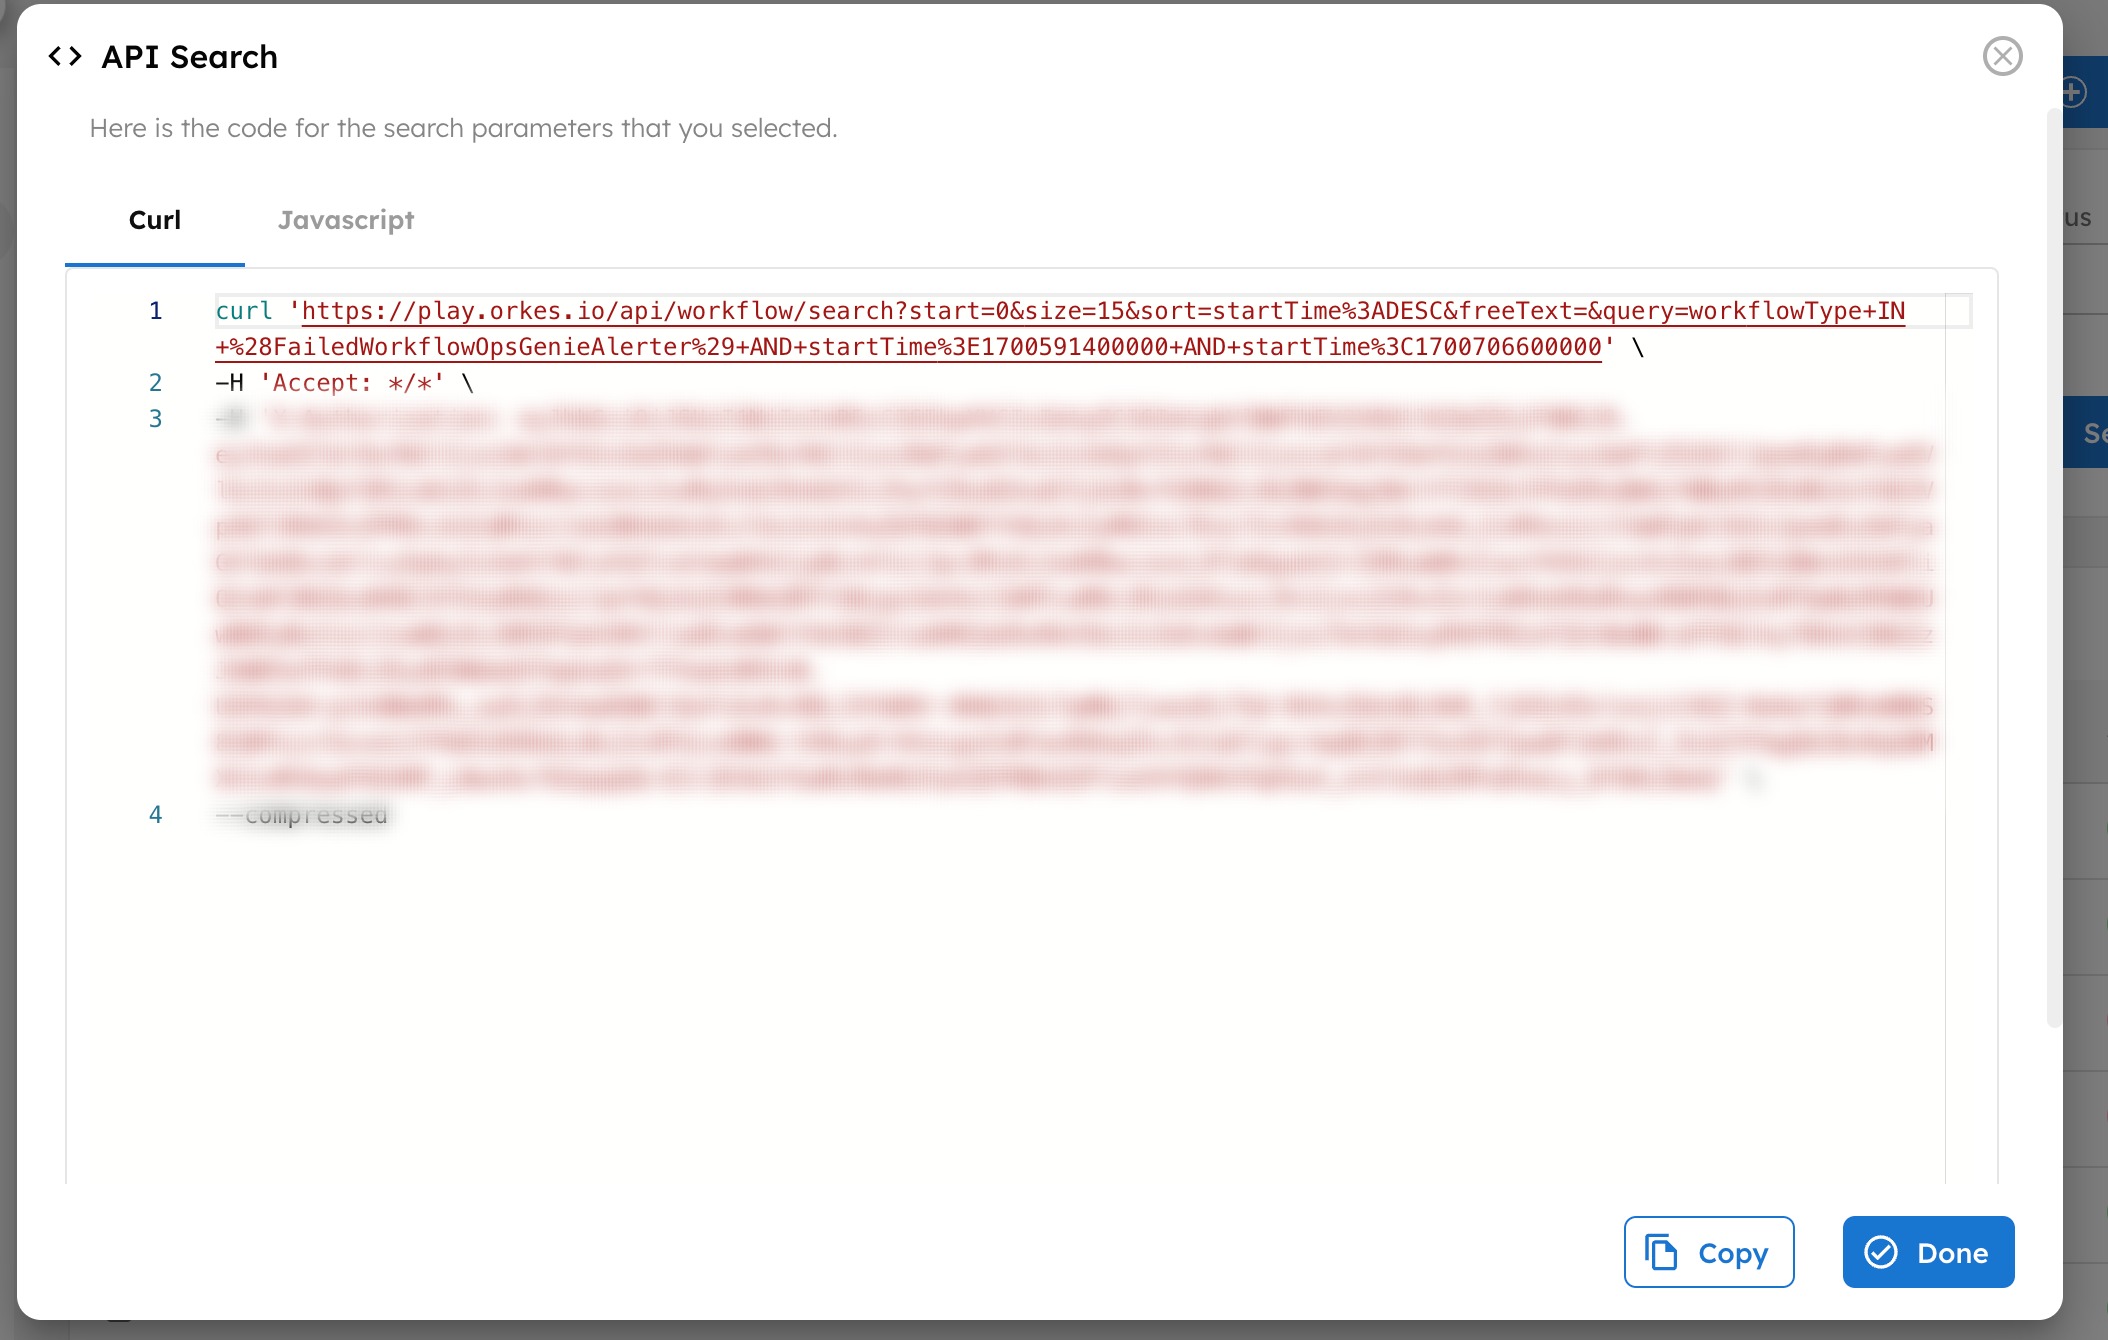
You can conduct searches via the Search Workflow Executions API (GET /api/workflow/search) as well. To help format your API search query, you can select the ⏷ (down arrow) icon beside Search > Show as Code to get the same search request as an API call.
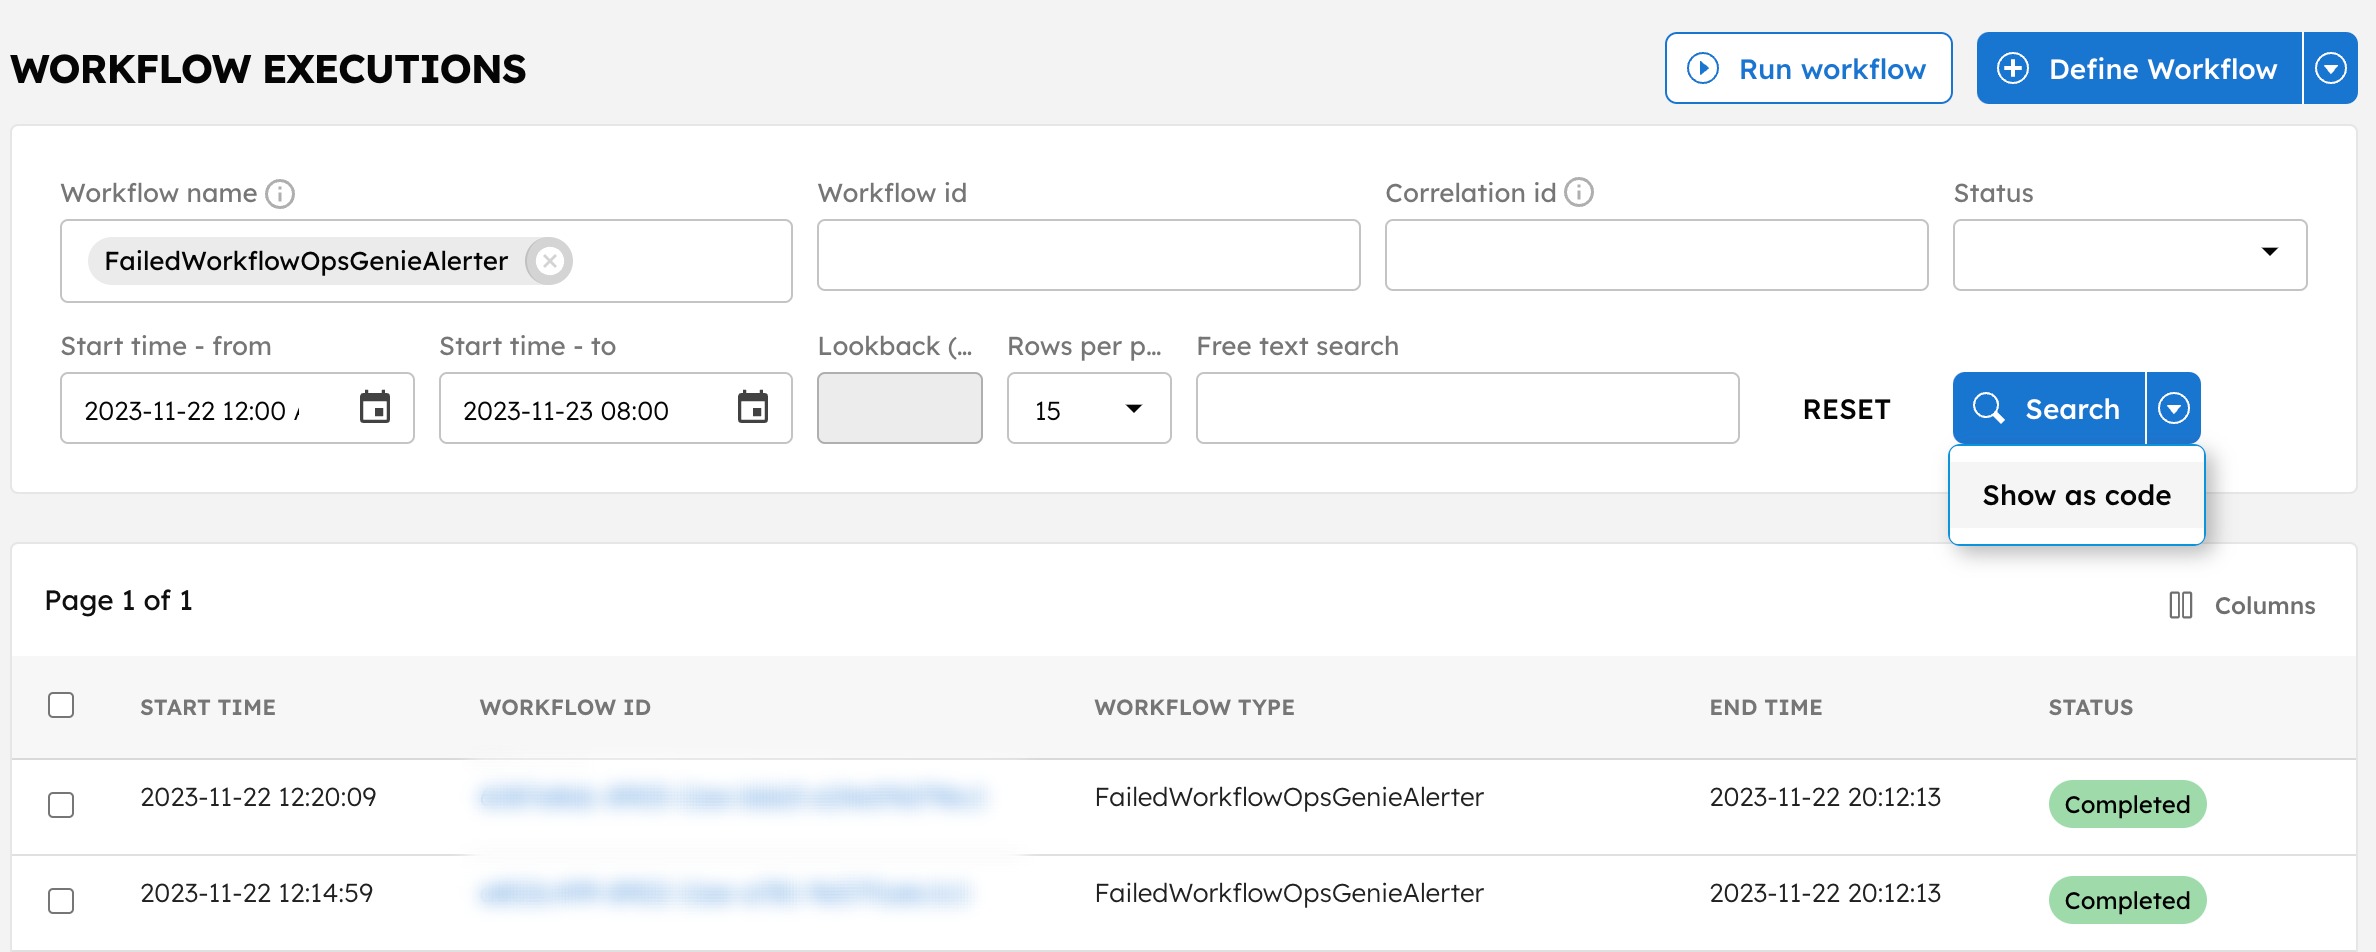
Currently, you can get the workflow search query in cURL and JavaScript.
Inspecting a workflow execution
In Executions > Workflow, select a specific execution to view the details. Here is an example of the execution details:
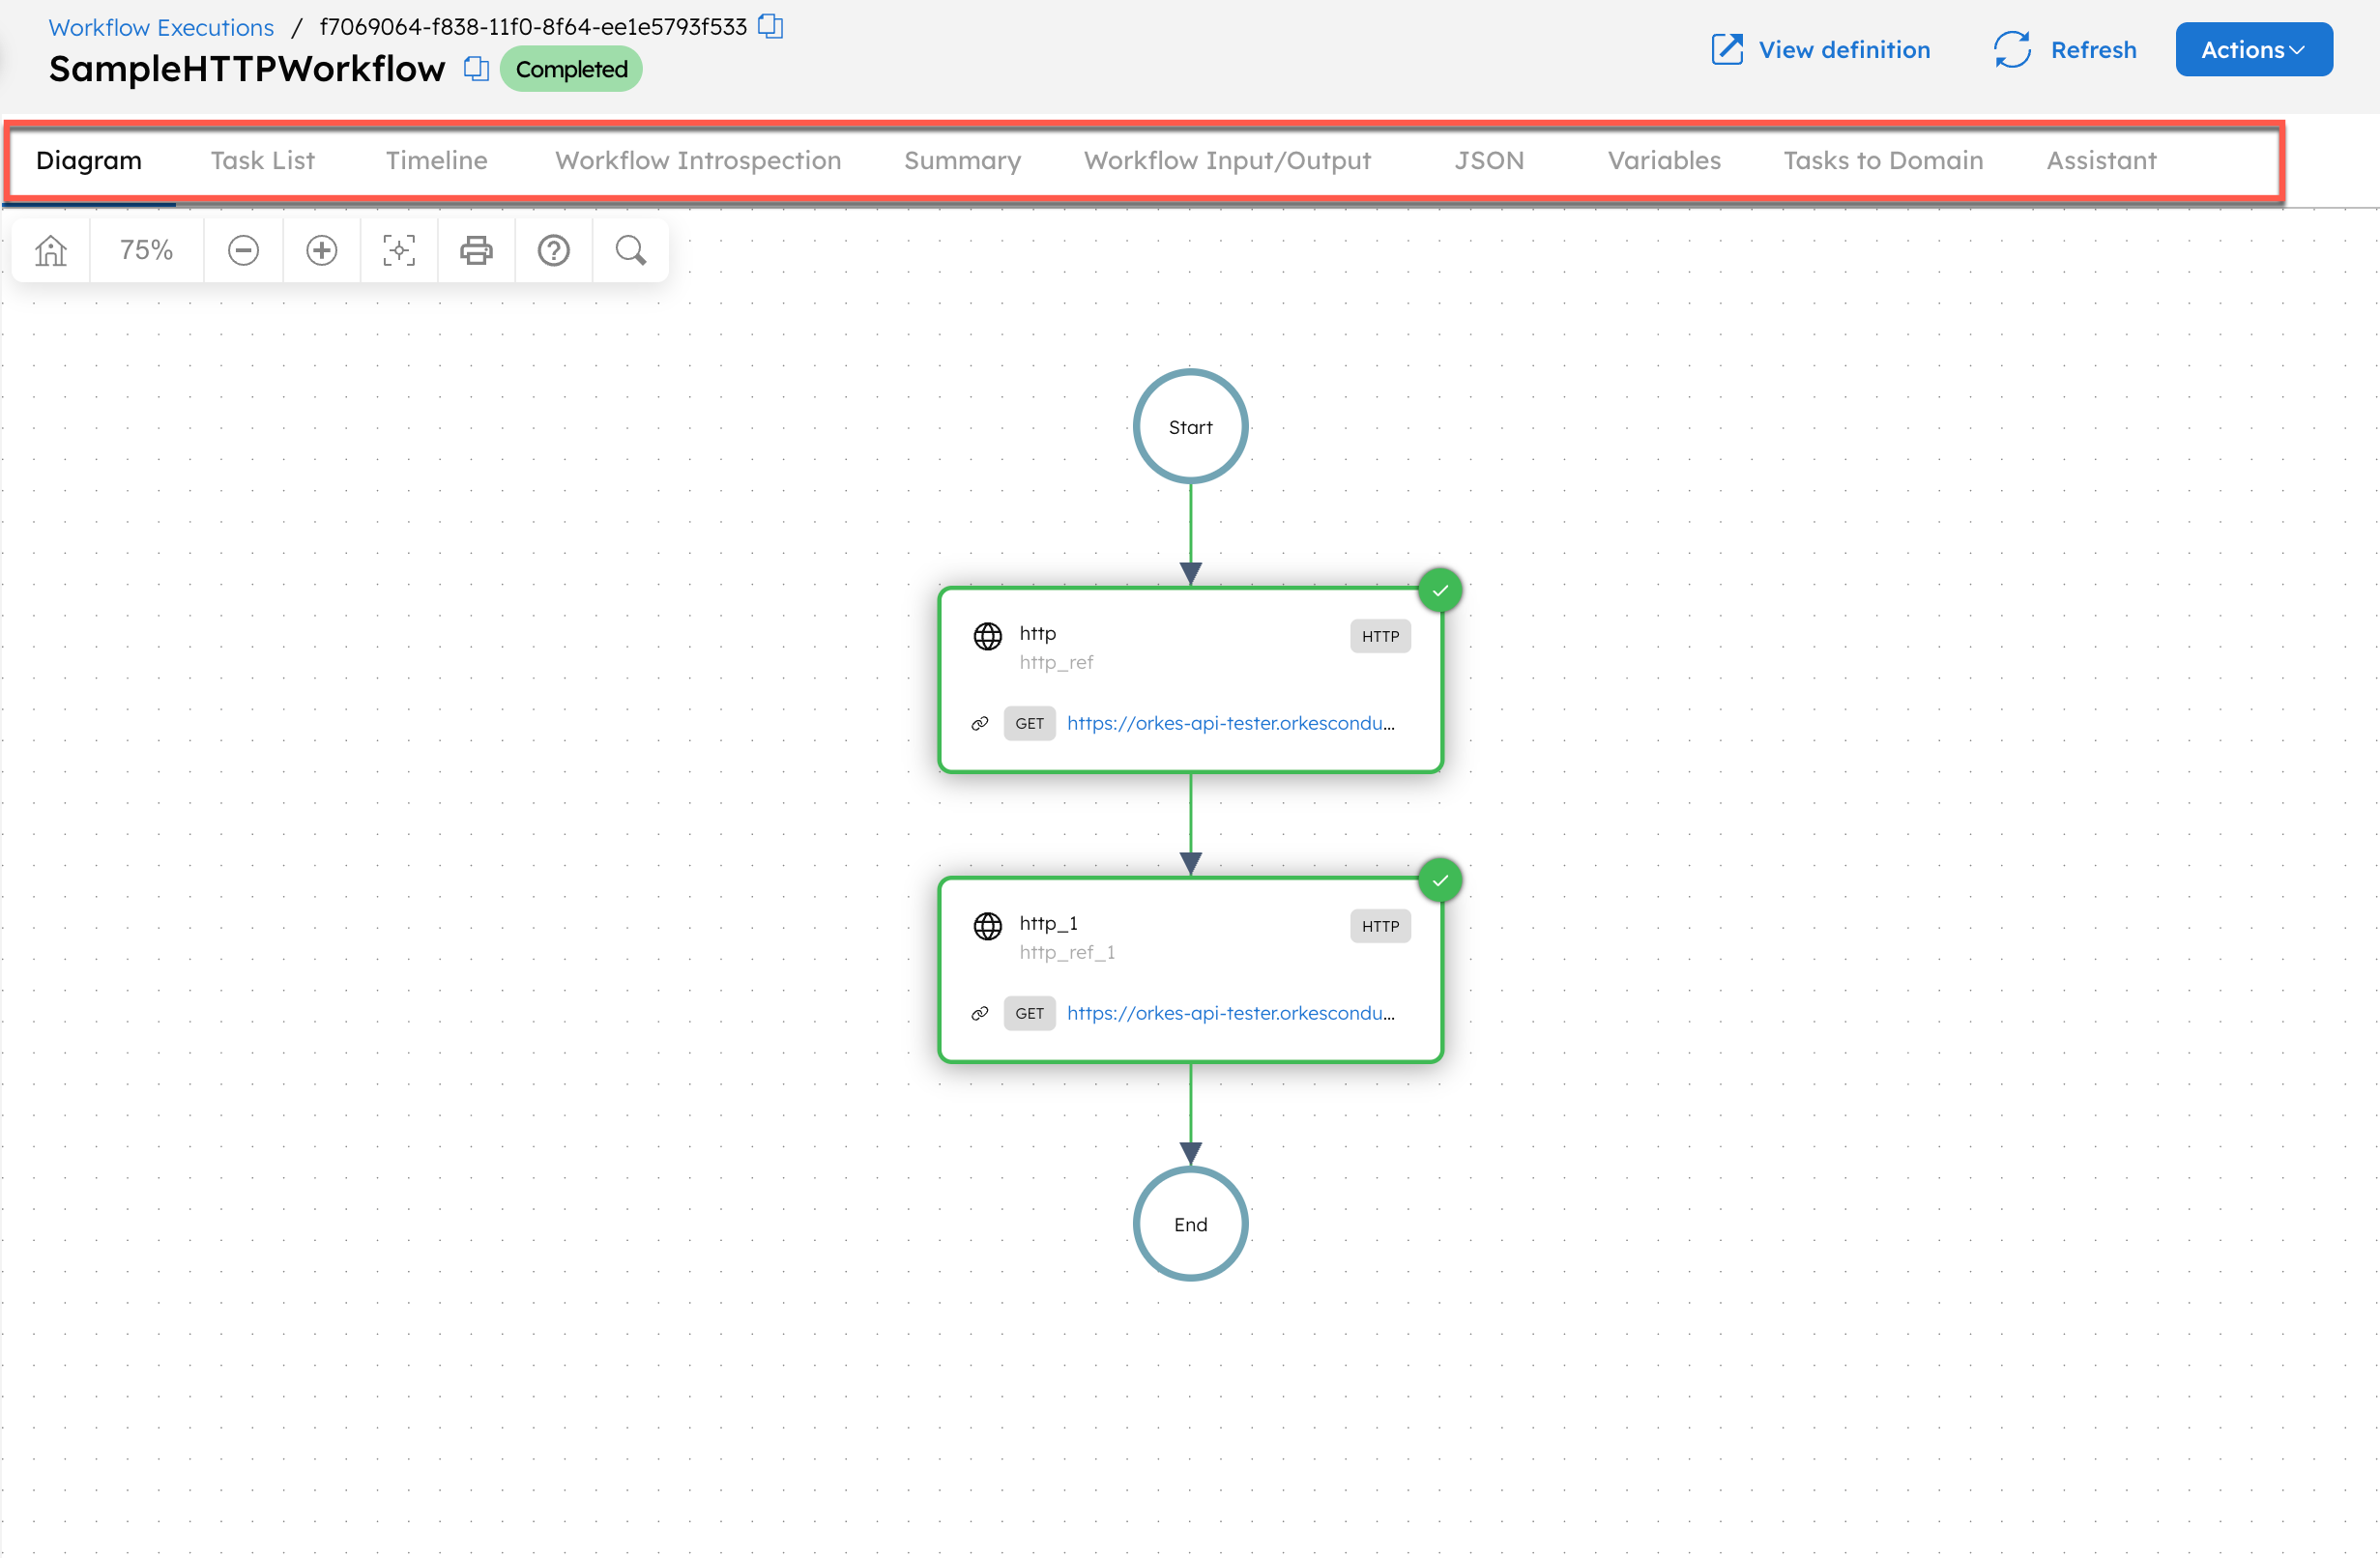
The introspection dashboard consists of the following tabs:
- Diagram: Visual diagram representation of the workflow’s task sequence and status, with zoom, search, and download functionalities.
- Task List: List of details for all tasks in the workflow, with an option to filter by task status.
- Timeline: Chronological timeline of task execution duration, with zoom functionality for granularity.
- Workflow Introspection: Visual breakdown of Conductor’s internal system operations during the workflow execution. Provides a timeline and detailed table to analyze scheduling, decision steps, and execution overhead.
- Summary: Summary of key workflow details like workflowId, status, version, start/end time, duration, and reason for incompletion (if any).
- Workflow Input/Output: Display for the workflow inputs and outputs.
- JSON: The full workflow execution JSON.
- Variables: Display for the workflow variables (created using the Set Variable task).
- Task-to-domain: Display for the task-to-domain mappings used in the workflow execution.
- Assistant: AI-based Conductor Agent that helps debug workflow execution using natural language prompts.
Each tab provides details that can help debug workflow issues.
Diagram tab
The Diagram tab visually represents task statuses in different colors:
- Green: Successful task
- Red: Failed task
- Orange: Task completed with errors
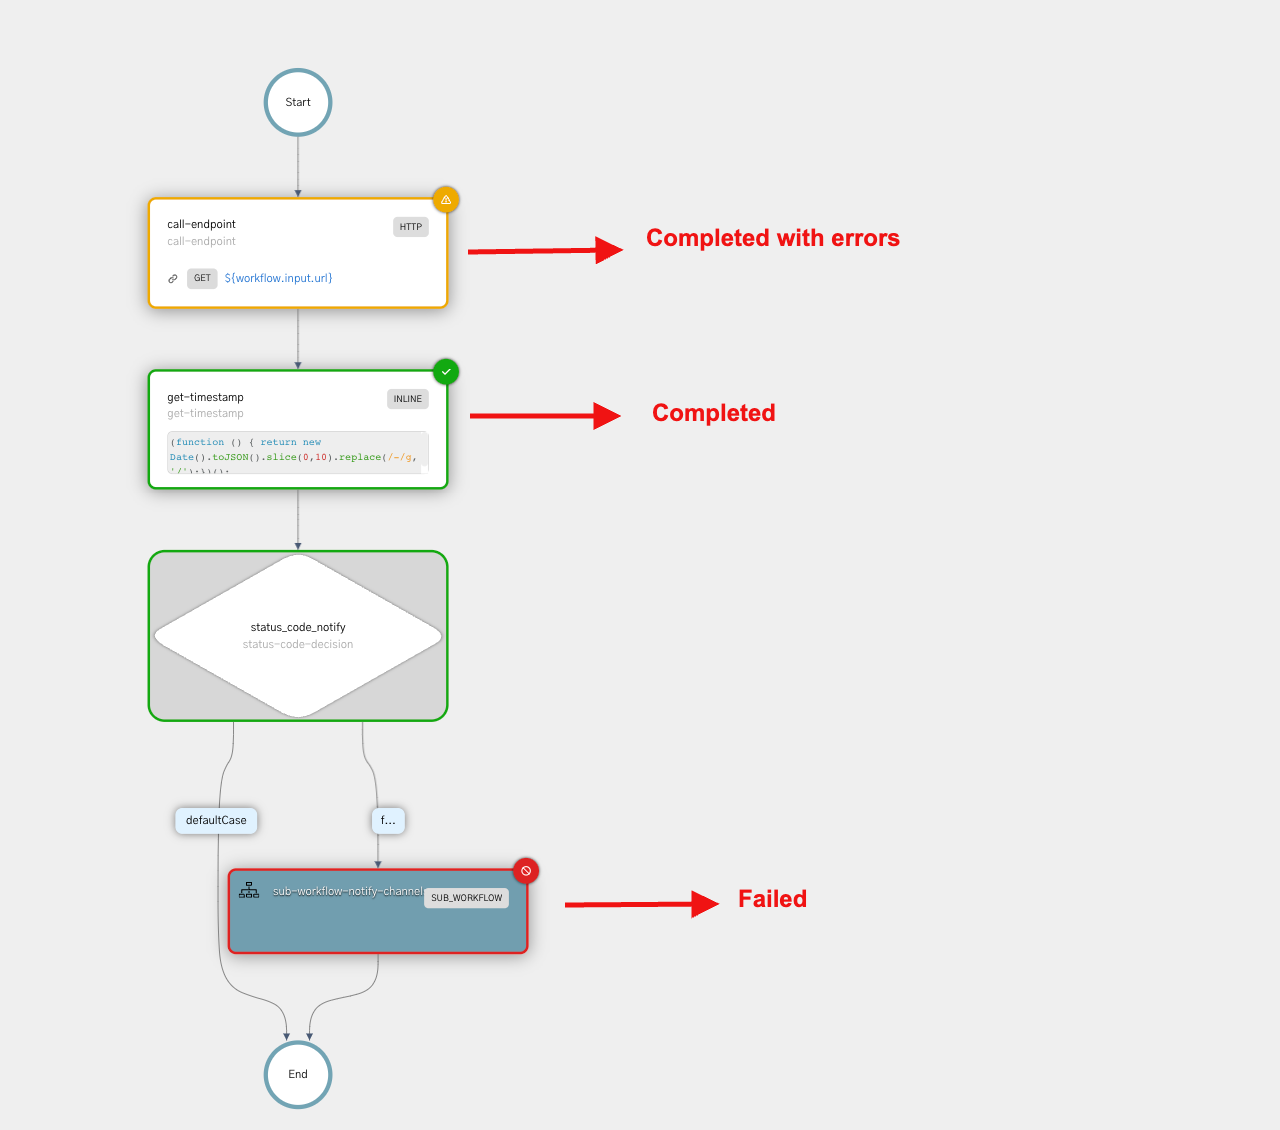
Refer to Workflow and Task Status for more information on the task status.
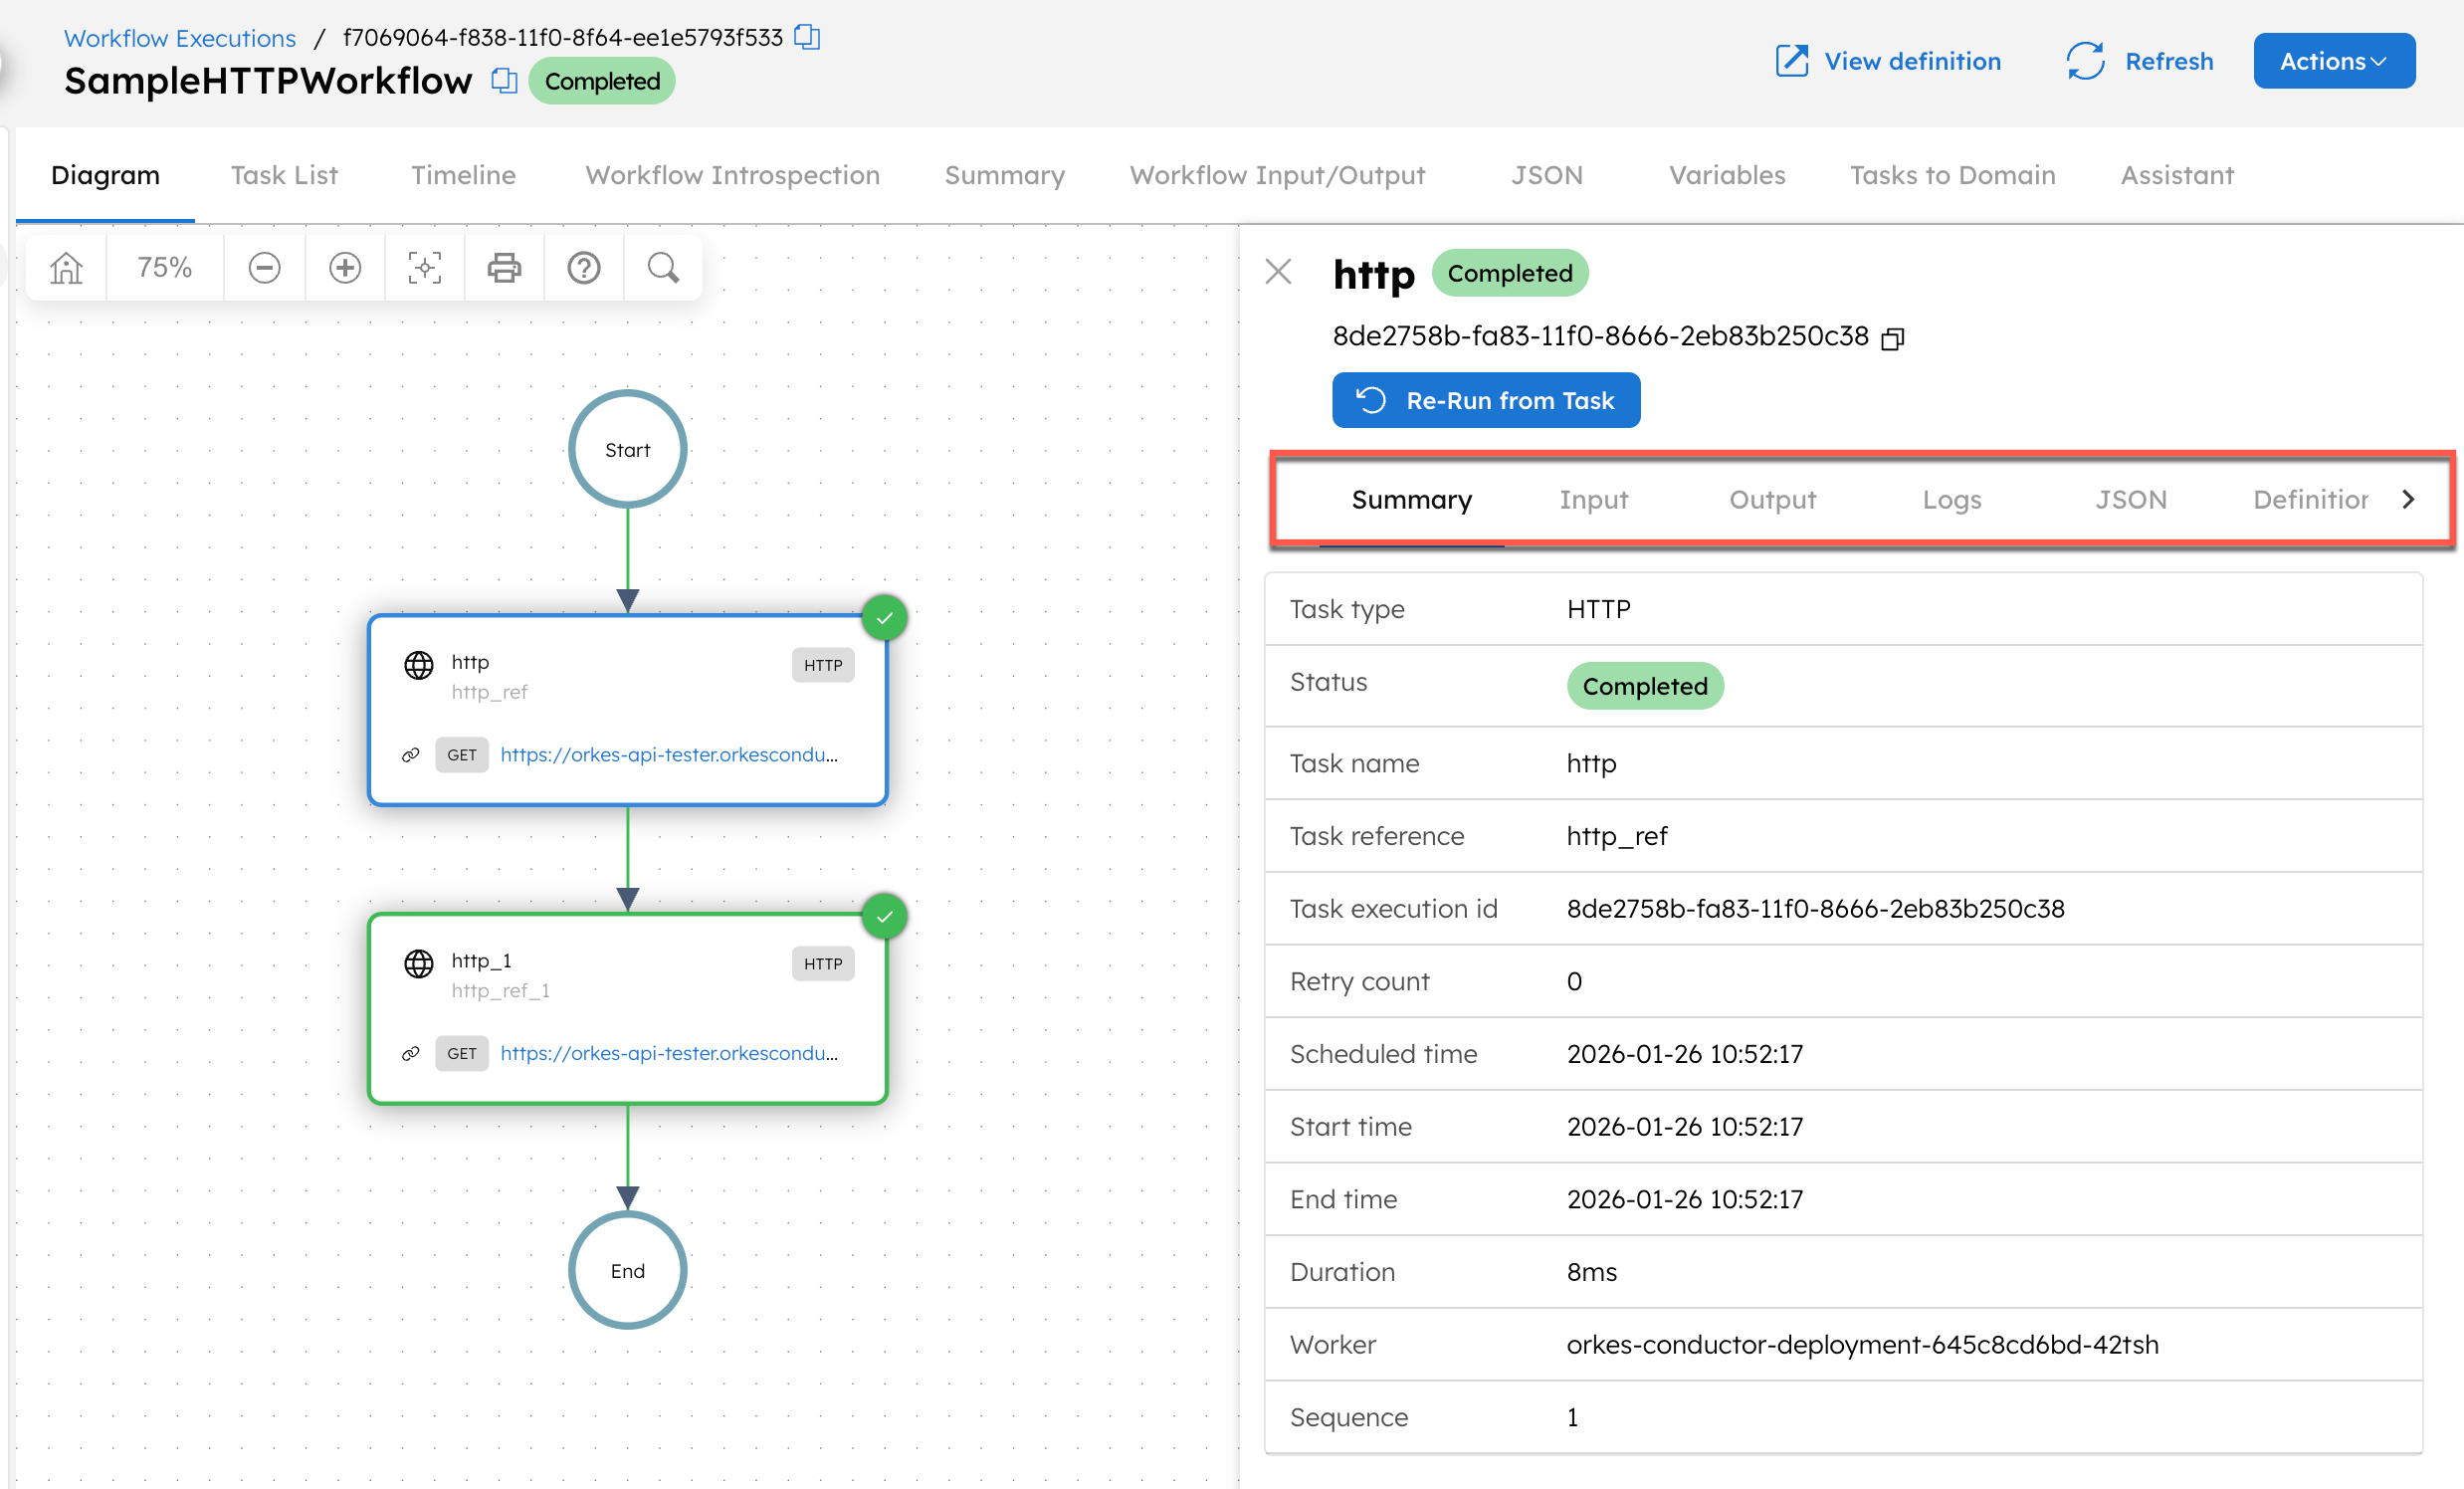
Inspecting a task execution
Selecting a task from the diagram opens a right-hand panel showcasing the task details. The task details dashboard consists of the following tabs:
- Summary: Summary of key task details like task type, status, retry count, duration, worker, reason for incompletion, and more.
- Input: Display for the task inputs.
- Output: Display for the task outputs.
- Logs: Logs for the task (if supplied by the task).
- JSON: The task execution JSON.
- Definition: The task definition used at runtime.
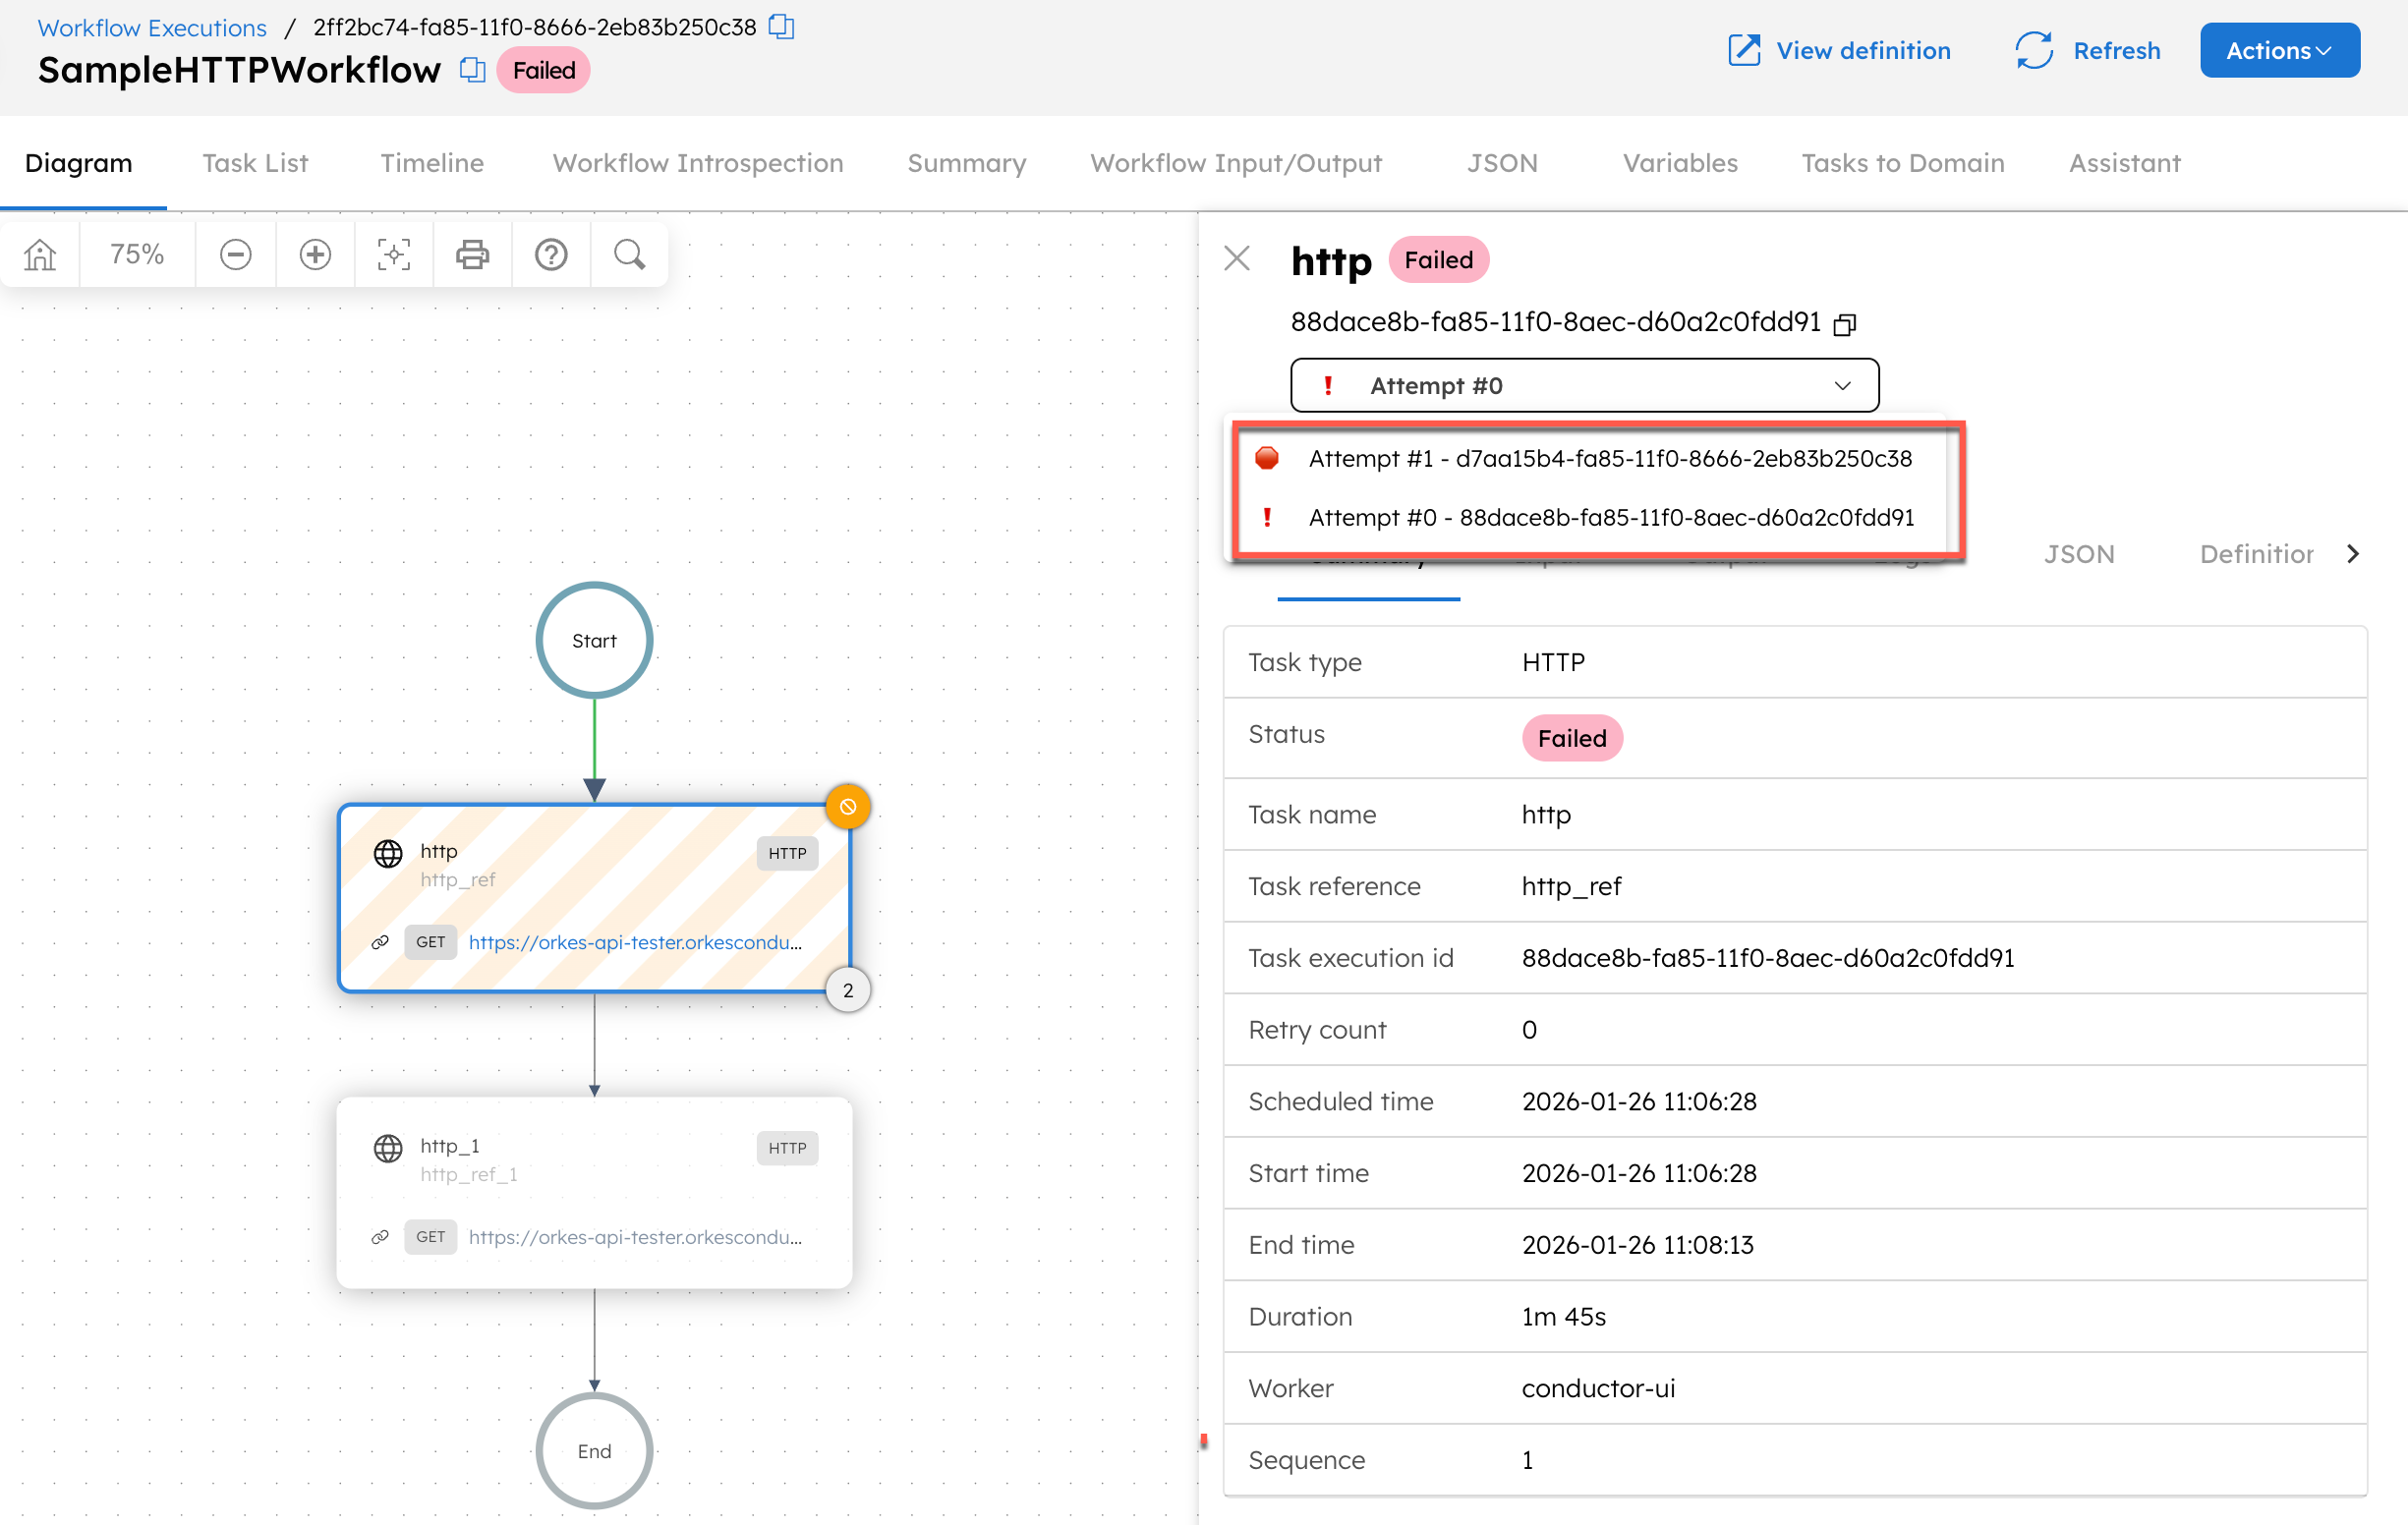
If the task has been retried multiple times, you can select an attempt from the dropdown bar and view the details for a specific attempt.
Debugging a failed task execution
To debug a failed task, you can try inspecting the following areas:
- Reason for incompletion: Located in the task’s Summary tab, it captures exceptions thrown by the worker or task, like “Failed to invoke HTTP endpoint”.
- Worker: Located in the task’s Summary tab, it captures the worker instance that polled for the task. This is useful for digging out logs that aren’t captured in Conductor.
- Task inputs: Verify if the task’s inputs were correctly provided and computed.
- Task outputs: Verify if the task’s outputs were correctly provided and computed, and compare them with any task inputs that reference these outputs.
Recovering from failures
Once the issues regarding the workflow failure are resolved, you can retry the failed workflows using the Actions button in the top-right corner of the page.
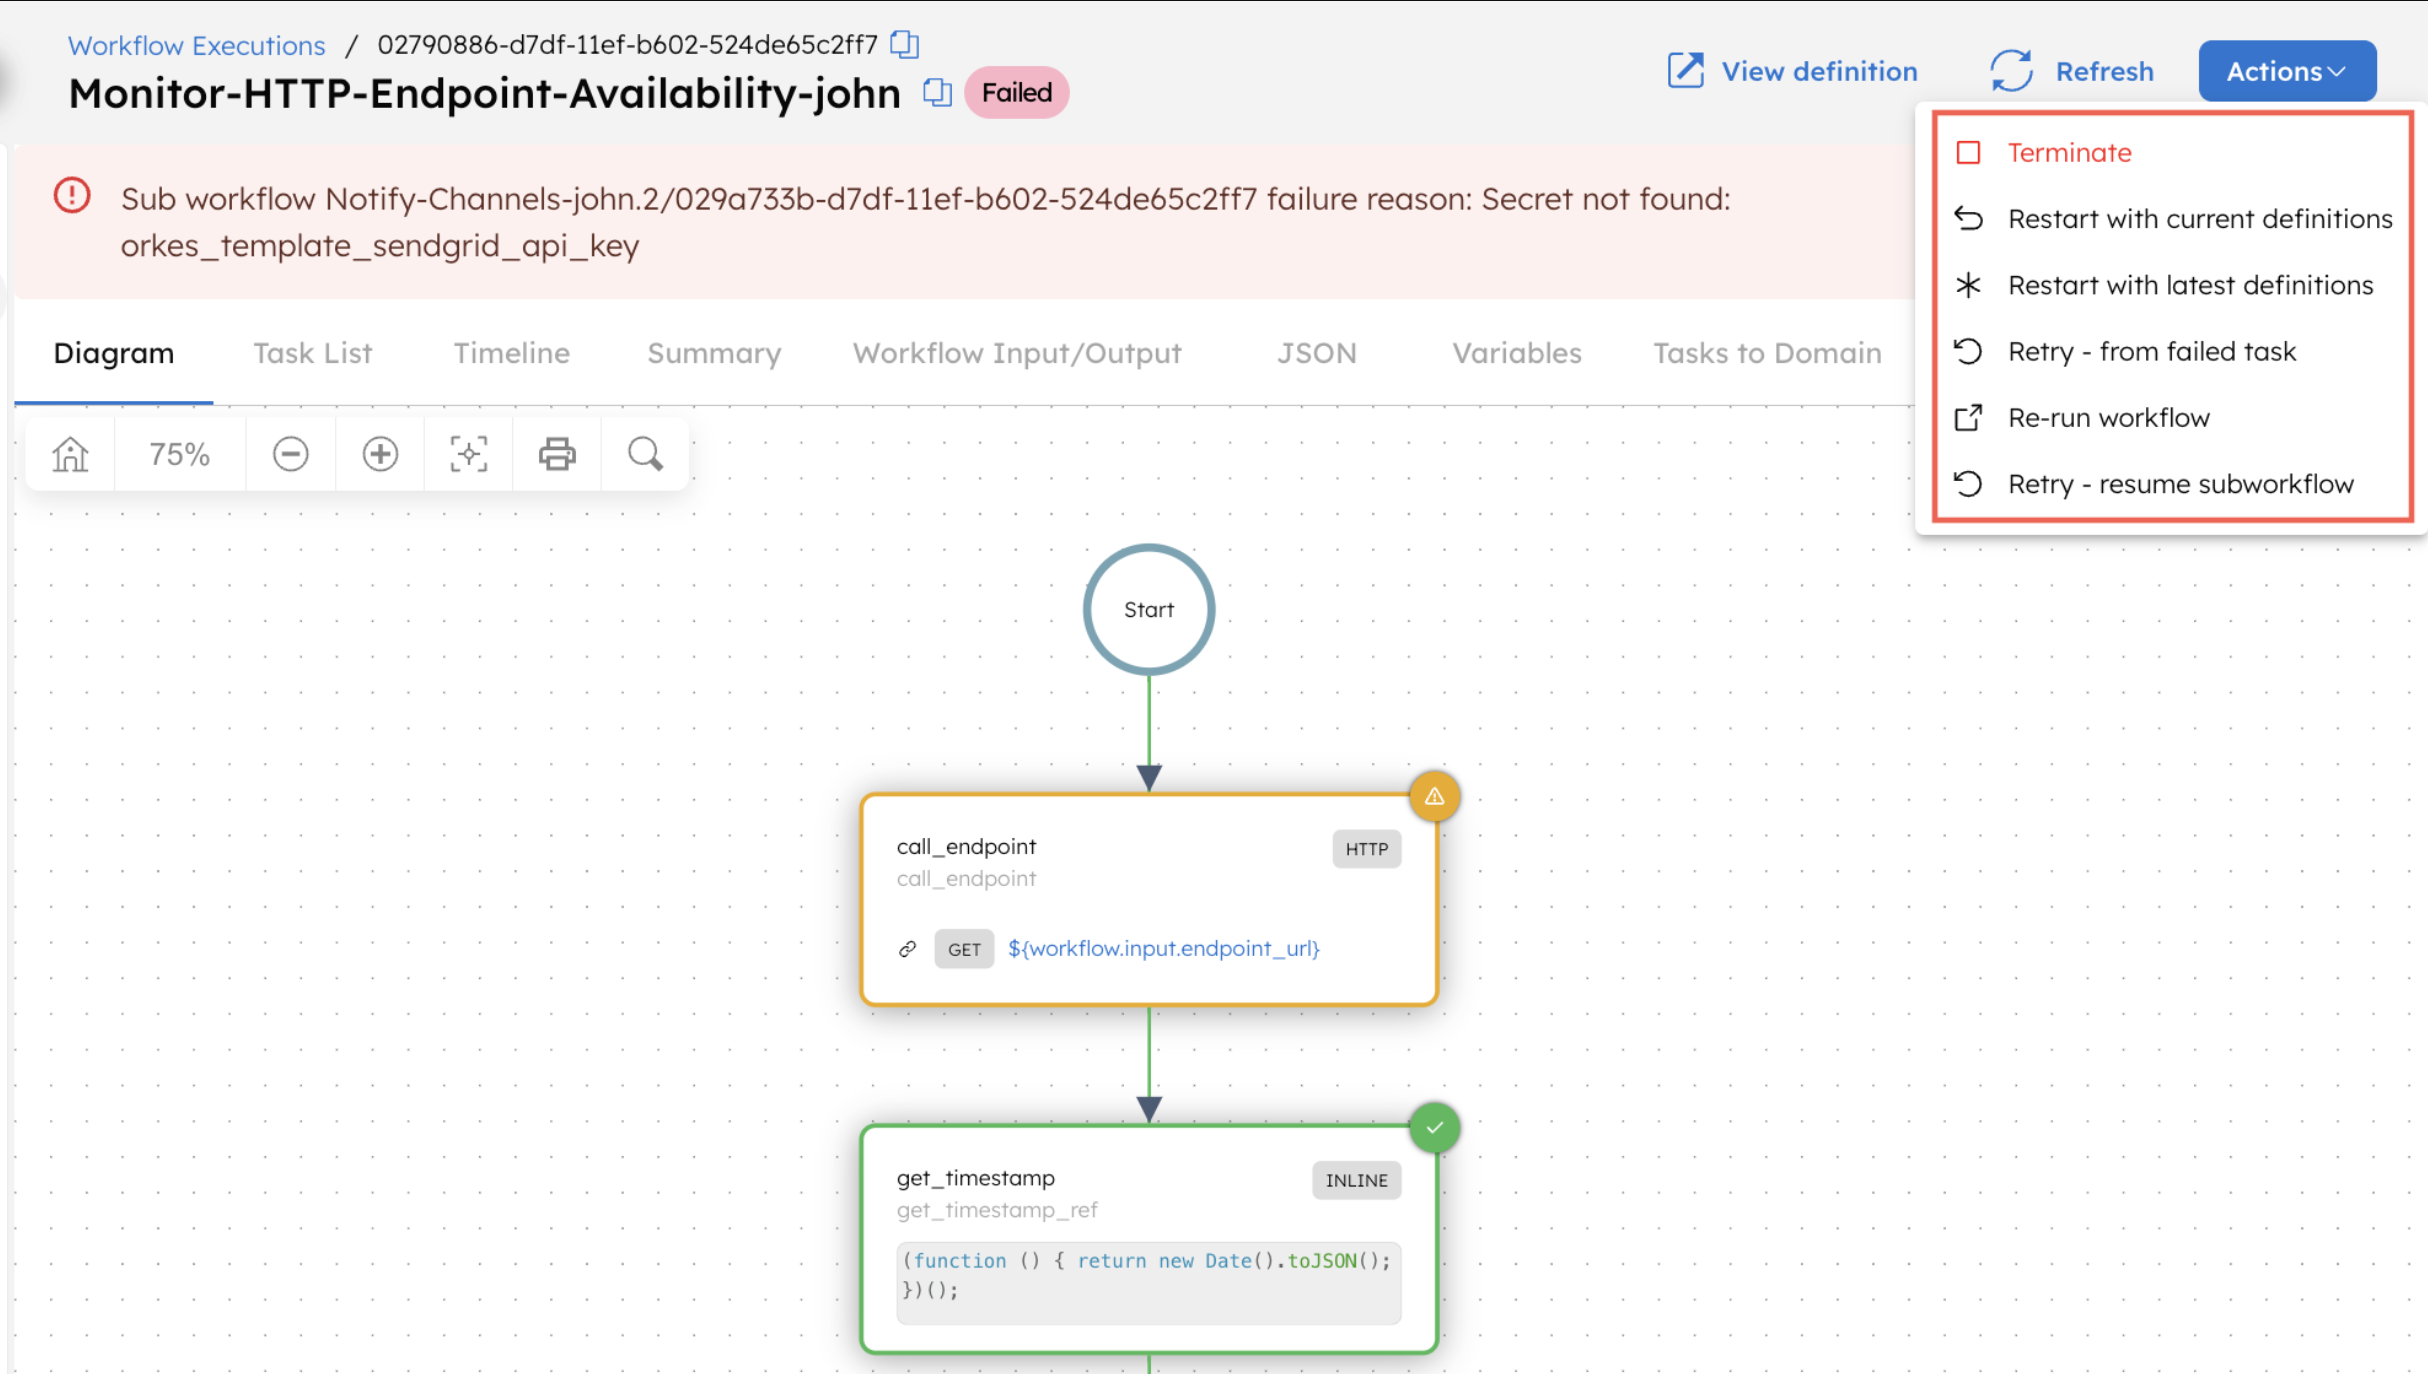
| Action | Description |
|---|---|
| Terminate | Change the workflow status to TERMINATED. |
| Restart with current definitions | Restart the workflow from the beginning using the same workflow definition that was referenced in the initial execution. This is useful if the workflow definition has changed and the original definition needs to be retained. |
| Restart with latest definitions | Restart the workflow from the beginning using the latest workflow definition and version. If you’ve changed the definition, you can use this option to rerun the execution with the latest version. |
| Retry - from failed task | Retry the workflow from its last failed task. |
| Re-run workflow | Run a new workflow execution instance with updated workflow input parameters, idempotency key, correlation ID, and task-to-domain mapping. |
| Retry - resume subworkflow | (Only if the workflow contains a sub-workflow) Retry the parent workflow from the sub-workflow’s last failed task. |
Common failure patterns
Task stuck in SCHEDULED state
Issue: A task remains in SCHEDULED state and does not get picked up by a worker.
Fix: Check the following in order:
- Task type name mismatch: The task type in the workflow definition must exactly match the queue name the worker polls. A mismatch leaves the task unclaimed.
- Worker not running or not polling: Check worker logs to confirm the worker is active and polling.
- Task domain mismatch: If the worker polls a specific domain, the task must be scheduled to that same domain. Check the task-to-domain mapping in the execution's Task-to-domain tab.
- Missing task definition: The task type must have a definition registered in metadata. Verify under Definitions > Task.
pollTimeoutSecondstoo low: If tasks are reachingTIMED_OUT, review thepollTimeoutSecondsvalue in the task definition. When this threshold is exceeded, the task moves toTIMED_OUTand the configuredtimeoutPolicyapplies.
Task keeps failing
Issue: A task repeatedly reaches FAILED or TIMED_OUT state.
Fix: Retrieve the reasonForIncompletion field, which captures the exception or timeout message set by the system.
- To read it from the workflow, call
GET /api/workflow/{workflowId}. Each task object in thetasksarray includes its ownreasonForIncompletion. - If you have the task ID directly, call
GET /api/tasks/{taskId}to retrieve the field from the task object.
Cross-reference the message with worker logs. The Worker field in the task's Summary tab identifies the specific worker instance that polled the task, which helps locate the relevant log output outside of Conductor.
The Logs tab in the task detail panel also displays any logs the worker explicitly attached to the task result.
Workflow hangs
Issue: A workflow stays in RUNNING indefinitely with no task activity.
Fix: Check whether the workflow contains a Wait task. A Wait task in progress shows as IN_PROGRESS. The workflow resumes only when the task is explicitly completed.
Ways to unblock a Wait task:
- Async signal: Send
POST /api/tasks/{workflowId}/{status}/signalwith the output map in the request body. - Sync signal: Send
POST /api/tasks/{workflowId}/{status}/signal/sync.
If no Wait task is present, check for a missing event that an event handler or external system was expected to deliver.